Details revealed by zooming in on very high resolution tissue images will aid cancer diagnostics
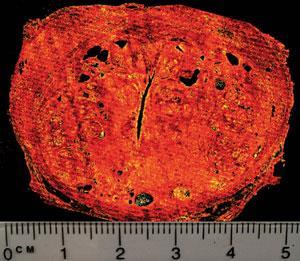
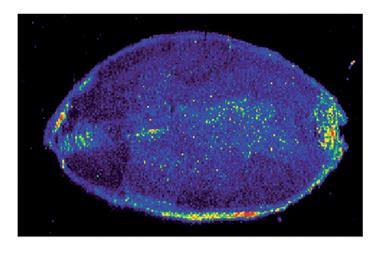
UK researchers have used vibrational spectroscopy to chemically image the cross section of a prostate to such an incredible level of detail that each of the 66 million pixels in the image represents a piece of tissue only 5.5 × 5.5µm.
Biopsies are regularly taken to diagnose cancer and provide a snapshot of the disease. Trained histopathologists examine the samples under powerful optical microscopes using several specialist stains to highlight particular characteristics of cells or tissues in a time-consuming process.
Peter Gardner of the University of Manchester and colleagues hope their technique, which uses Fourier transform infrared (FTIR) chemical imaging, will eventually be turned into an automated system that can grade and stage biopsy samples 24 hours a day by identifying certain chemical signatures.
Commenting on the work, Shaul Mordechai, an expert in optical diagnostics at Ben-Gurion University in Israel, says ‘an automated system could be constructed whereby the chemical image is initially classified into its constituent cell types, after which the epithelial cells can be classified as cancerous or non-cancerous. This work could be used to create an FTIR imaging system to assess early tumour diagnosis.’
Infrared spectroscopy generates a spectrum which provides a fingerprint of all the molecules present within a particular area of tissue. Advances in detectors and computing power now mean that rather than a single spectrum from the tissue, many spectra can be put together to make a chemical map.
Previously, only millimetre sized sections of tissue could be measured to a high enough degree of accuracy to produce a chemical map. Spatial resolution had to be sacrificed if larger areas were looked at, losing detailed information.
The team have now sped up the process to the point where very large areas of tissue can be measured at the highest spatial resolution available. ‘Normally data collection, data readout and data pre-processing are carried out sequentially. Parallelising these processes and optimising each step has led to a huge gain in efficiency,’ explains Gardner. ‘Previously, using a conventional infrared microscope, it would have taken 125 years to collect 66 million spectra and, even using an off-the-shelf instrument with a large array detector, the same data would have taken 14 days. We have reduced this to just 14 hours.’
Gardner reiterates that everything is measured at high resolution in one go: ‘it can be viewed “google map” style at any time in the future so that any part of the sample can be analysed at the single cell level.’


No comments yet