Henry Rzepa explains why our data deserves a place all its own
The topic of sharing data, big and small is, well, rather big at the moment.1 Data is the currency of science; sharing it enables research, and doing so transparently and openly supports reproducibility. However, approximate estimates are that more than 80% of the data collected in chemistry is not available in any open or searchable manner, which represents an enormous wasted resource and creates the potential for a lack of transparency. With funding agencies in the UK and abroad also pushing to increase transparency for publicly funded research, it is time to rethink how data is shared.
Share and share alike
Digital repositories, initially associated with open access publishing but now focusing on data, are a possible solution. My own journey here began with an experiment in 2001, when Peter Murray-Rust and I published an article showing how data could be semantically integrated2 into the narrative of an article, a result of the Chemical Markup Language project.3 Peter coined the expression datument4 in 2004 to describe these enhanced articles, and I set out to create more examples (about 40 during the period 2005-2013)5 as an encouragement to others, most of which have links to our own digital repository.6
One of these coincided with the launch of Nature Chemistry in 2009. Anticipating that they might be willing to experiment, I submitted (and they accepted)7 an interactive exploratorium, hosted by the journal itself, and followed this up with a variation looking at bonding to helium.8 Both items contained interactive figures, the latter also incorporating re-usable data, and the full data sets in each case were deposited into this new breed of digital repository.
However, when David Scheschkewitz and I recently submitted another such article to the same journal, we were informed they could no longer handle such interactive tables. We had to find a way to host and present our data-rich object ourselves.
A table and the data it contains are a scientific tool in their own right and should be cherished
Of course, we could simply fill a Word document with our data and submit it as supporting information (SI), like everyone else. But, to put it bluntly, SI is not fit for purpose. These documents are often poorly structured and contain semantically-void scanned images. Moreover, Word documents or, even worse, PDFs are not good carriers of data, which prevents the data from being easily re-used. A table and the data it contains are a scientific tool in their own right and should be cherished, not abandoned in the darker and often uncurated recesses of the journal.
Also, nowadays SI documents can exceed 100 pages, which is just too much for most referees to properly scrutinise (although bloggers seem to do a far better job).
In short, data should be presented in a form that allows humans to browse it (interactively and visually), and machines to find and act on it.
Our solution is to propose a two-component model, in which the article and the data are separately published. In our case, Nature Chemistry has published the article, and Figshare the data.
In this scenario, the article is the ‘narrative’ into which the relevant, yet still distinct, data is woven. A key point here is that the data itself is citable (a principle of the recent Amsterdam Manifesto on sharing data). With both components being individually citable, they become equal symbiotes. The narrative9 cites the data and the data10 can refer to the narrative. The data inherits trust from the narrative’s peer review, and the narrative inherits a date stamp and integrity from the data. Each can have a different publisher and, importantly, the presentation of each can be optimised for its own needs.
Ideally, the data should have two layers: the raw data and an interface to present it. The reader can then access either layer, depending on their needs. Software (for example, data mining, semantic annotation and search11 or error detection) would focus on the raw data.
Open all ours
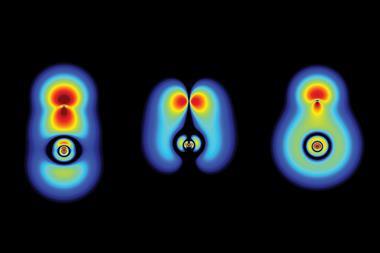
This is all perhaps best illustrated by example: the narrative exists at DOI: 10.1038/nchem.1751 and the data can be viewed at DOI: 10.6084/m9.figshare.744825 either as the presentation layer, or 10042/20409 as (some of) the original data containing full details. Alternatively, I can embed the figure straight into this document:
There are many advantages to this approach. The roles of data publisher and article publisher are separate, so each can specialise for its particular task. The data can be used multiple times in multiple narratives and, hosted on an open repository, can be freely available (while the narrative may or may not be, according to the publisher). A whole infrastructure can evolve devoted to enhancing the cited data. Sharing raw data also safeguards against data manipulation. And with each component separately citable, a researcher could become known for their published data as well as their published narratives, or even for narratives of others’ data. These are just some of the items on my list of benefits, and others would no doubt find more.
We can even adopt the same data sharing principles for informal discussions and responses, such as a recent blog post I was inspired to write by Chemistry World’s coverage of research into the unusual FSSF3 molecule.12
So before you submit your next article for publication, ponder how you might share its data. Use a digital data repository (if your institution has one), or a site such as Figshare as we have. Activating the data in your research publications may be easier than you think (the above example and four others took place over a matter of weeks). And spread the word!
Henry Rzepa is professor of computational chemistry at Imperial College London, UK
Please note that this article requires a java runtime environment installed on your browser to present the interactive element


No comments yet