
Researchers in the UK have found a simple mathematical process that efficiently suppresses the NMR signals of macromolecules in biological samples to leave behind quantitative small molecule data.
Omics is the study of complex biological systems such as genes, proteins or metabolites, and the field is increasingly using NMR to identify small molecules or metabolites in systems like urine. As well as helping researchers to understand biological processes, this sort of analysis can be diagnostic as well. NMR has many advantages, being non-destructive and quantitative, so it features extensively in large-scale automated metabolomics studies. However, complex biological systems contain numerous macromolecules like lipids, proteins, and sugars, all of which produce very broad NMR signals that can swamp the spectrum. Macromolecules mask small molecule data and it is the job of NMR metabolomics researchers to tease out this hidden information.
‘For 15 years a set experimental procedure has been dogmatically followed’ to remove these broad signals says Panteleimon Takis of Imperial College London. The procedure almost always includes a spin-echo experiment to suppress signals from macromolecules. Spin-echo experiments can take up a significant amount of time and, despite being ubiquitous, Takis says they are ‘surprisingly ineffective at suppressing the broad background signals’. Quantitative information is lost in the process as well, removing one of the key advantages of using NMR.
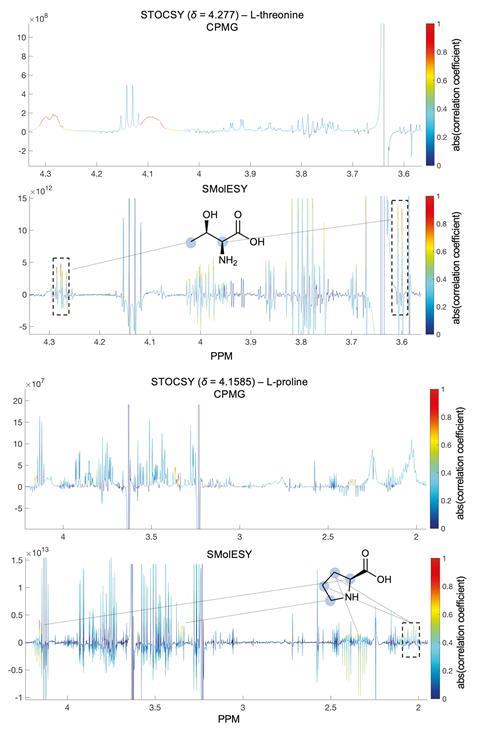
Takis and his Imperial co-workers have taken a new approach to the problem by devising a mathematical way to remove the broad background signals. ‘The key to making this work is the calculation of a 1st derivative of the imaginary part of the NMR spectrum, which yields a profile of small molecules free from broad signals and baseline interference from large molecules.’ Numerical derivatives are widely used in spectroscopies, not just NMR, but the team was surprised to find that they had not been routinely used and applied for suppressing broad NMR signals in to metabolomics pipeline.
They’ve named the freely available method Smolesy, which is short for small molecule enhancement spectroscopy. It helps to speed up the process of metabolite assignment because it significantly enhances spectral resolution, without increasing the size of the raw data file. It can also be applied to data that has already been gathered so users don’t need to run new experiments. Most importantly, baseline removal offers the opportunity to quantify metabolites via direct integration of their Smolesy signals without needing tricky fitting algorithms. This final point has been extensively verified by the team across a wide range of systems ranging from a set of albumin solutions at different concentrations to a set of over 3000 serum and plasma samples from large epidemiological cohort studies.
‘The most challenging part of our work was to convince ourselves that Smolesy data are reproducible while not affecting the NMR fingerprint of small molecular weight metabolites,’ says Takis. ‘We strongly recommend that Smolesy should be implemented and tested in the NMR metabolomics, foodomics and nutritional studies pipeline of every laboratory.’
‘The computational approach is both elegant and deceptively simple,’ says Rafael Brüschweiler from The Ohio State University, US, who develops techniques to analyse complex biological mixtures. ‘By taking the numerical 1st derivative of the dispersive part of the spectrum they emphasise the sharp metabolite signals of interest while muting the unwanted background. It is likely to become a standard tool in the burgeoning field of metabolomics.’
References
This article is open access
P Takis et al, Chem. Sci., 2020, 11, 6000 (DOI: 10.1039/d0sc01421d)


No comments yet