Classifying snow photos to learn more about climate change
Growing up in the north-west of England, it was rare that our winters yielded enough snow to accommodate a fleeting snowball fight, let alone build a snowman. And yet whenever I was lucky enough to witness the first flakes beginning to fall, my heart was filled with excitement, anticipation and the hope of heavy drifts.
A team of researchers at the University of Utah in the US has been sharing the beauty of falling snow with members of the public, inviting them to take a closer look at individual flakes in the name of science.
Snowy snaps
Kyle Fitch started the Snowflake ID project with colleagues while studying for his PhD as part of the aerosol-cloud-climate systems group at Utah (led by advisor Tim Garrett who is professor in the department of atmospheric sciences).
‘The dataset I was working with was several hundred thousand, I think even over a million images from a camera system that my advisor had developed,’ explains Fitch.
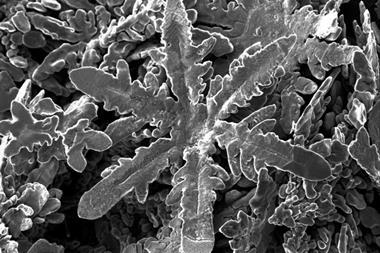
The images in question were of snowflakes, each taken by a multi-angle snowflake camera installed by the US Department of Energy in the North Slope of Alaska. This specialist camera is designed to automatically take photographs of falling snow from three different angles at high resolution and rapid exposure times, thereby creating huge amounts of image data for analysis by scientists.
The images are not just beautiful. Analysis of characteristics such as size, shape and density of snowflakes provides information that enables ‘accurate forecasting of severe weather and global climate change’. ‘We have a pretty good body of research that has told us for several decades now that there’s a pretty clear relationship between the temperature in the cloud and the amount of supersaturation in the cloud,’ says Fitch.
For example, snowflakes that are particularly intricate, or as Fitch describes them ‘ideal snowflakes … the ones you tend to see in art galleries and photography collections’ typically grow in supersaturated environments. Similarly, temperature also impacts the shape of the flakes.
‘In one temperature range, you tend to get more of a long, cylindrical type shape, and then in another temperature range you tend to get something like a broad, flat plate type shape, but all based on a hexagon, which is kind of neat,’ says Fitch.
Ploughing through the data
‘So, we had all these images, all the data that came from those images, and we wanted to extract some microphysics information from all of these images,’ says Fitch. ‘I started evaluating different machine-learning models to see which one would work best with these snowflake images.’
The team realised the potential of engaging citizen scientists who could learn more about snowflakes while building a robust dataset that could be used to teach computers to analyse images automatically. The project was hosted on the citizen science platform Zooniverse, where close to 60,000 classifications were performed by volunteers.
‘It also kind of became a science outreach project because we started working through the Nasa education outreach office … with some schools in [the] New York City area,’ says Fitch. ‘The teachers would do a lesson on snowflake basics and how snowflakes grow and that sort of thing, and then [the students] would take what they learned and go on Zooniverse and actually practice classifying snowflakes … applying what they learned that way.’
New data drops
Fitch has since completed his PhD and is now an assistant professor of atmospheric science at the Air Force Institute of Technology in Dayton, Ohio, but shared that the broader team behind Snowflake ID is keen to continue to keep the project alive once it has overcome a few technical challenges.
‘We’re planning to have these follow-on launches where we bring in more data from other locations,’ says Fitch. ‘The challenge we ran into is that we’ve built the pre-processing a certain way for the initial dataset we had, but [the data] really changes with the different locations, you know, how it’s formatted and everything. So, I think Tim [Garrett] actually has a student that he’s working with to make [the pre-processing] more general so that we could receive camera data from all of these different locations and put it up on Zooniverse.’
The opportunity to work with citizen scientists was enriching for Fitch and the team. ‘It’s fun to get involved with students and citizens in general who are interested in this work,’ he shares. ‘And I think people – scientists and citizen scientists – like looking at these images. It’s sort of fun to see all these different snowflake images, especially in such high resolution.’


No comments yet