Five tips for presenting data clearly
They say a picture is worth a thousand words, and nowhere is that more true than in science. It’s hard to think of a single paper, textbook or research presentation that doesn’t depend upon figures or schemes to help explain the data. ‘Part of the role of an image is that it can convey an idea so much more efficiently, clearly and accurately than words can achieve,’ says Michaela Livingstone-Banks, head of public and community engagement with research (MPLS Division) at the University of Oxford, UK. But while good graphics can help us understand complex information with ease, poorly designed images can be confusing or misleading. Here, experts explain the common pitfalls and how to avoid them.
Be clear and concise
There’s always a temptation to include as much of your hard-won data as possible when producing a figure. However, the best images tend to be relatively simple and uncluttered, with a single clearly identifiable message. ‘Removing details and chart junk that aren’t relevant to your message is very important,’ says Tracey Weissgerber, group leader at the QUEST Center for Responsible Research at the Berlin Institute of Health at Charité – Universitätsmedizin Berlin in Germany. ‘When you have a lot of information in the same figure, the eye doesn’t know where to look.’ Avoiding unnecessary data points and clutter can help to focus an image but missing information can be just as confusing. Labels, legends, keys and annotations are all valuable supporting elements that are necessary to help the reader navigate the image. ‘It can be helpful to ask, “what information do I need to understand this figure?” and make sure that information is clearly visible and labelled,’ says Weissgerber.
Know your audience
‘There are lots of good reasons for scientists to communicate with audiences who aren’t fellow scientists,’ says Livingstone-Banks. Interactions with businesses, consumers and even school children are all valuable for maintaining public interest and trust in scientific research and images are often a more engaging way to share this information than blocks of text. Each group has different needs and the tone, purpose and level of information in your images all need to be adapted to ensure they are appropriate for the target audience. ‘If you try and do one thing for several audiences, you’re actually compromising how engaging or useful it is for everyone,’ explains Livingstone-Banks. Having a clear message in mind and understanding how different people relate to science can help to focus the design of your image. ‘A really good place to start is to talk to someone from your target audience,’ suggests Livingstone-Banks. ‘If you sit down and start to draw out the particular idea, then you’ll very quickly see what it is they find interesting and how they are imagining it in their minds.’
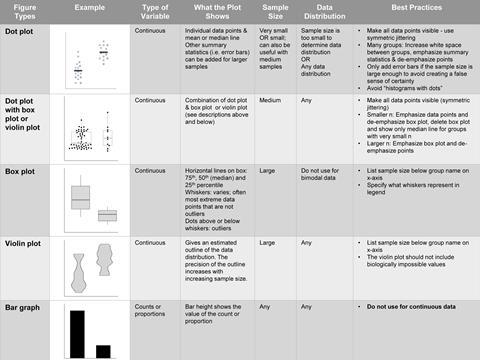
Think about your figure type
Collecting results and data are second nature to scientists but working out the most effective way to present this information can be surprisingly challenging. With so many different types of charts, figures and graphs it is often difficult to know which will emphasise the key parts of the data best. ‘A common mistake is people using bar charts to present continuous data,’ says Weissgerber. ‘Bar charts are great for counts or proportions, but it’s a summary statistic so if you use it for continuous data then you lose all of this very rich information about sample ranges and distributions.’
This loss of information richness can be mitigated in part by including the raw data as supplementary information. But in some cases, the damage may have already been done. ‘Summary statistics may suggest different conclusions from the actual data points. That’s one of the ways that graphs can mislead,’ explains Weissgerber. Creating an environment among researchers where people are comfortable critiquing and asking for feedback is an important step and Weissgerber suggests talking through new figures with other members of your research group. ‘Increasingly there are also online tools available which can screen preprints and manuscripts to highlight good and bad visualisation practises,’ says Weissgerber.
Choose colours carefully
Colour can be a valuable addition to scientific images, but with around 4% of the population experiencing some kind of colour vision deficiency, how we use it has a significant impact on who is able to interpret the data. ‘Colour is a very useful tool and allows you to highlight specific details or guide the eye,’ says Felix Kaspar, a postdoctoral researcher at Technische Universität Braunschweig, Germany. ‘But it’s important to consider the role that colour plays. Is it a supporting element or does it actually represent information?’
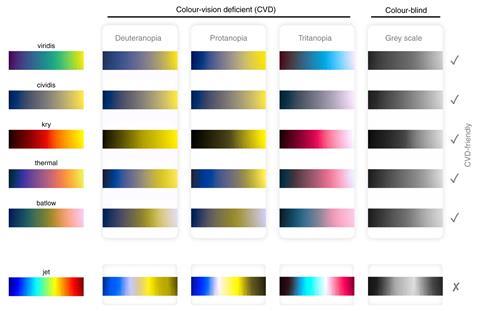
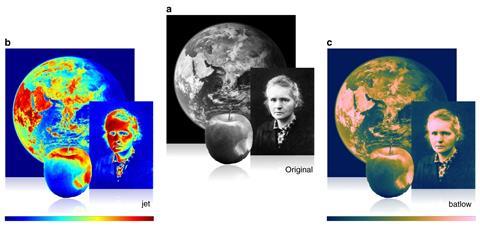
To be universally accessible, all of the information encoded by colour still needs to be perceptible in grayscale. But for many of the most popular colour schemes, this is simply not the case. ‘Rainbow is the default setting in many programs, but the red and green are not distinguishable to many people,’ explains Fabio Crameri, a freelance researcher and graphic designer at Undertone.design, Switzerland. ‘The inconsistent gradient also distorts the underlying data.’ Kaspar and Crameri recommend using scientific colour palettes to avoid these problems. These colour schemes have a property known as perceptual order, meaning the change in colour properties (hue, saturation, and lightness) is consistent along the scale and the data remains accessible with or without colour. ‘Most software packages give you the option to select or import a scientific colour scheme,’ says Crameri. ‘There are lots of resources which you can just download.’
Ask for help
Surprisingly, the majority of science courses do not include any statistics or data visualisation training, something which Weissgerber considers a major oversight. ‘In many fields poor visualisation is standard practice so people just assume that’s how it’s done,’ she says. ‘I think getting scientists good visualisation training is really important and I would encourage students to ask for workshops or classes to fill this knowledge gap.’ Weissgerber’s visualisation course ReproducibiliTeach is now available on YouTube.
But even having decided on your figure design, creating the graphic itself from scratch can seem like a daunting task. ‘If you can, it’s often worth paying an expert, but obviously, this isn’t always practical,’ says Livingstone-Banks. Most academic departments will have a dedicated IT team who will be able to offer some technical support regarding software training and best practices, so it is worth finding out what help is available. ‘There are also programs like Canva which have lots of existing templates which you can use for infographics, posters, and other scientific graphics,’ says Livingstone-Banks.


No comments yet