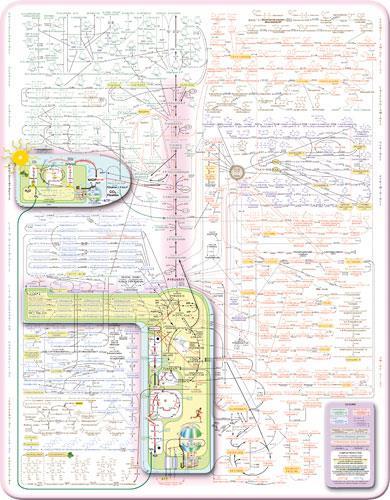
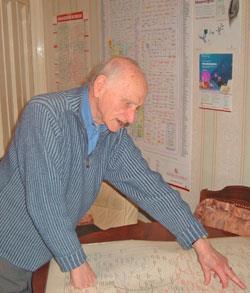
The metabolic pathways chart is one of the most enduring icons of the biochemical sciences, illustrating how all the biochemical cycles relate to each other. The chart was created by Donald Nicholson, who continues to work on it at the age of 90. Here, he
The metabolic pathways chart is one of the most enduring icons of the biochemical sciences, illustrating how all the biochemical cycles relate to each other. The chart was created by Donald Nicholson, who continues to work on it at the age of 90. Here, he tells his story
I was born in 1916 in Leek in Staffordshire, UK. My father was a Methodist minister, which meant that we had to move house every three years. It was a dreadful sort of life where you could never put down roots. Schooling was a big problem until eventually I was sent to Kingswood school in Bath, founded by John Wesley as a school for the children of Methodist ministers. I left when I was 16 years old, having initially failed my school certificate examination. But with the encouragement of the headmaster AB Sackert I re-took the exam and passed it. In 1932, jobs were scarce and it was very difficult to find work. At the time I didn’t know what I wanted to do. My best subject at school had been chemistry, and eventually I found myself at Huddersfield Technical College studying for a degree in colour chemistry. In 1936 I was awarded my degree but, as we say in Yorkshire, ’nobbut just’. I had scraped a pass.
In Huddersfield was a branch of ICI Dyestuffs with a link to the college. It sponsored a large amount of research there and the head of the department suggested I enrol for a PhD. I completed my PhD in 1941 and got a job at Boots in Nottingham. It was a wonderful, wonderful experience. My first job there was hugely exciting and important, involving the development of a large-scale production process for sulfanilamide, the first antibacterial agent. This was a huge climax in my life; a key milestone.
A turning point
I left Boots in 1946 and this is where the rest of my life begins. After the war, ICI wanted to integrate university research much more closely with industrial research and was awarding research fellowships. There was one going in chemotherapy at Leeds Medical School in the department of bacteriology, which I applied for.
I was interviewed by the head of the department, James McCloud, a wonderful man with a pronounced Scottish accent that I could not understand. He talked a lot about bacteriology, about which I had no knowledge. I understood nothing during the interview. He offered me the post but I reluctantly wrote back to say that I did not think it was right for me. McCloud wrote straight back, asking if I would reconsider my decision. I accepted.
After three years, my fellowship came to an end and I was appointed lecturer. As far as I can recall, I was the only chemist in the department of bacteriology and when I became a lecturer I inevitably was given bacterial metabolism to teach. Again I had to start from scratch, teaching university students something that I had myself known nothing about until the previous year. This was a huge challenge. I would sit in on lectures myself as a student, a valuable experience that allowed me to assess what was good and what was bad about lecturing methods.
Metabolic pathways
Teaching bacterial metabolism meant learning metabolic pathways. When I received my PhD the first metabolic pathways were being put together and by now it was a very active area. By the time I started teaching, quite a few pathways were known and over the next few years more and more were found. By about the mid-1950s there were maybe 20 pathways known for making or breaking down well-known biological molecules such as amino acids and sugars.
This presented me with a problem. We were teaching students these pathways, but for what? We could learn how serine was made, but what is the purpose of this? Metabolism is about more than individual pathways. It is only when these pathways are put together that the whole story makes sense. To me one thing became obvious: here we had an unmade jigsaw puzzle that needed assembling.
I created my first chart in 1955. I took a large sheet of tracing paper and some stencils and drew the pathways by hand - everything we knew at that time. I took the finished product to the architects’ department and had a few dozen blueprints made.
Creating the charts was very stimulating, an intellectual challenge, and it had huge ramifications. New discoveries were being made continually and I had to update the chart all the time. I repeated the exercise for the next four or five years, producing three versions in this way, until 1960. I then decided I would need to find someone to print it. The first versions were in black and white, but I soon realised it was important to have colour.
Finding someone who could print in colour was difficult. I talked to the drug firms and well-known publishers but no one was interested. Eventually I found a little-known producer of biochemicals called Koch-Light, based in Buckinghamshire, UK. I sent them a copy of my chart and they wrote back saying ’this is a masterpiece’. Of course that was wonderful, and furthermore they agreed to publish it - that was in 1961.
The chart showed all the pathways, dealing with amino acids, sugars, fats, purines, and pyrimidines, and illustrated how each pathway relates to everything else. It showed a central backbone into which everything else fed and from which everything arose. The backbone is basically the way in which energy is formed and upon which all biosynthesis depends.
The first print run was several thousand, and after that it became very well known. For example, a US firm used to take 20,000 small maps and 10,000 of the big ones every year for its annual congress.
For the next 23 years Koch-Light published the chart. Over that time we had 18 new editions. I used to call it my annual pregnancy; virtually one a year. I was still teaching, but the charts took a lot of time. This suited the university - its name appeared on the chart and it was a fantastic advert for both the university and the department. Koch-Light produced some 800,000 charts. For the first 10 years I received very little income from the charts, but later I did receive a few thousand pounds a year, which was very welcome with a growing family. My involvement with the chart also took me to meetings around the world and I met some wonderful people.
Creating new charts was a painstaking process. You started off with a blank sheet of paper and hundreds of small pieces of paper with printed names and structures, which you literally glued on and joined up with arrows. They had to be put in exactly the right place and if you made a mistake it was dreadful. But it was even more complicated than that. Because of the colour separation process, it was necessary to produce a separate sheet for each colour - four or five colours were used - and each colour represented different pathways, so that when they were superimposed they all fitted together correctly, arrows joined up in the right places and so on. It was very tricky.
New era
Eventually Koch-Light was taken over and the company disappeared, so I had to find a new publisher. I knew one of the directors of Sigma-Aldrich [a US life science and technology firm]. He had been interested in the charts for many years and was keen for Sigma-Aldrich to publish them. And really that was the beginning of the new era because it was right up to date in its ability to do this kind of thing. A new word entered my vocabulary - digitisation. That revolutionised things.
Never again would I have to stick millions of little pieces of paper onto a big piece of paper. We are now into the 22nd edition, which was published in 2003.
I retired from the university in 1981, but I have never retired from producing the charts. About 10 years ago I became concerned about the future of the chart and what would happen when I am no longer around. I approached the International Union of Biochemistry and Molecular Biology and offered it the copyright. It was delighted and accepted my offer. The charts are freely available on the internet and anyone in the world can download them. They are a wonderful educational resource.
Chart drawbacks
A few years after the first chart had been produced I discovered a big snag. The chart was beautiful, but it was being misused. The intention had been to make metabolism meaningful and to show how everything flows together. But the charts also became an easy way to set examinations. Over the world people had to learn this stuff. Instead of seeing the beauty and symmetry, students were recoiling in fear and terror.
I wondered how best I could get medical students to find something useful in the charts. It suddenly struck me that there were five or six hundred enzymes in the map. Enzymes are encoded by genes and genes can go wrong. This can give rise to abnormal enzymes and the metabolic pathway stops at that point. These are inborn errors of metabolism, and so to make the pathways more meaningful to medical students we produced inborn errors of metabolism charts, where the names of diseases and the associated enzyme defect are listed at the side of the map, with arrows indicating the point on the pathway that is affected. These have been extremely popular.
Minimaps
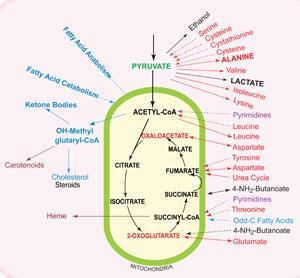
I have also created a number of ’Minimaps’ of individual pathways. I received a computer for my 80th birthday and have produced several of these maps, which are A4-sized and show where in the cell the various metabolic processes occur in a given pathway. I am also working on ’Animaps’. These are animated reactions showing what happens to reactants when they enter the active site of an enzyme, and how bonds break and are formed, resulting in the products. This sort of thing brings a new meaning to the whole concept of what chemistry is and how it works. I am currently learning how to use Flash on the computer, and we will ultimately be looking to use three dimensional animated models for the Animaps.
So I am still busy, in fact busier than I have ever been. It is no chore. Sometimes I work until midnight - it depends on how the spirit moves.
Donald Nicholson spoke to Simon Hadlington, a science writer based in York, UK.
1 Reader's comment