

Using chemometric analysis of attenuated total reflection (ATR) spectroscopy helps scientists pinpoint impurities in recycled plastic streams
As concern grows over the amount of waste we send to landfill, demand for recycling innovation has increased – particularly for plastic waste. Separating different types of polymers is essential to ensure the recycled product is suitable for reuse. Although every effort is made to ensure a pure recycled plastic is obtained, contamination is inevitable and therefore methods are required to quantify impurities.
Using FTIR spectroscopy and chemometric analysis, Specac applications scientist Andrew Davies analysed polypropylene (PP) impurities in polyethylene (PE). Chemometrics is the application of statistical tools to the measurement of chemical properties.1 One of these tools is Partial Least Squares (PLS) analysis, a method to find the fundamental relationship between two related matrices.
‘Multiple different plastics might have different properties and will have been selected for use on that basis,’ explains Davies. ‘If you were making scientific equipment for example, you might have chosen PP because it is chemically inert – then if you find that the product actually contains even traces of PE, it might affect that.
‘Or if you were looking for rigidity from your product, you might suddenly find the end product isn’t quite as hard as it might have been. Ensuring the polymers made from recycled products using this method provides the safeguard and evidence your product needs,’ adds Davies.
PP and PE can be easily distinguished by differences in their infrared spectra
In this case, the first matrix is comprised of the ATR-FTIR spectra, whilst the second matrix is the sample composition data. A model is first constructed using spectra of known composition. The model is validated against further spectra of known composition and once validated can then be applied to swiftly determine the composition of unknown real-world samples.
Comparing spectra
In order to compare the spectra of PP impurities in PE, blends of the two polymers were prepared by melt-blending the two polymers at 160°C. To minimise potential sample inhomogeneity, five aliquots were taken from each blend, a spectrum of each recorded and then averaged together. Spectra were recorded on a commercially available spectrometer equipped with a Specac Quest ATR, with 32 scans co-averaged together at a resolution of 4cm-1. Chemometric modelling was conducted using a commercially available software package.
Spectra were pre-processed by obtaining the second derivative to accentuate differences in the spectra, and minimise the effect of baseline variation. Ten blended and two pure PP/PE samples were prepared and used to build the PLS model. In order to validate the model, an additional eight blends and two pure samples were prepared and the known sample concentration compared to the predicted composition from the PLS model.
The Specac Quest single reflection ATR is designed for use in the mid and for IR. The Quest features on all reflective gold coated optical design based on Specac’s proprietary SynoptiFocal array technology.
- Excellent spectral quality due to the Quest’s high throughput capability
- Choice of interchangeable ATR crystal pucks: Diamond, ZnSe, Si and Ge
- Specular reflectance puck, flow through anvil and liquid puck options available
- Heated puck option under development
- Monolithic diamond design is more robust and durable than diamond wafer designs
- Suitable for mid and far IR (10,000-40 cm-1) depending on choice of crystal
- Reproducible 40lb load applied with a slip-click loading tower
Distinguished analysis
PP and PE can be easily distinguished by differences in their infrared spectra – particularly the absorptions relating to the methyl side groups on the PP chain.
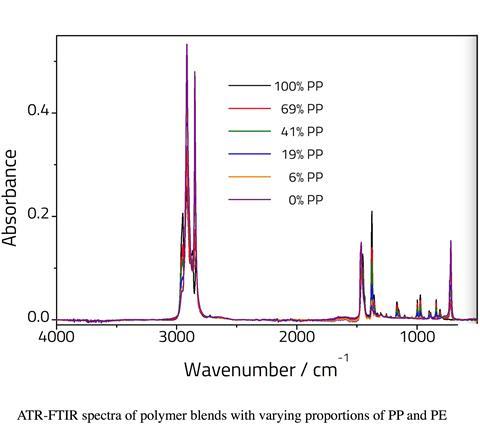
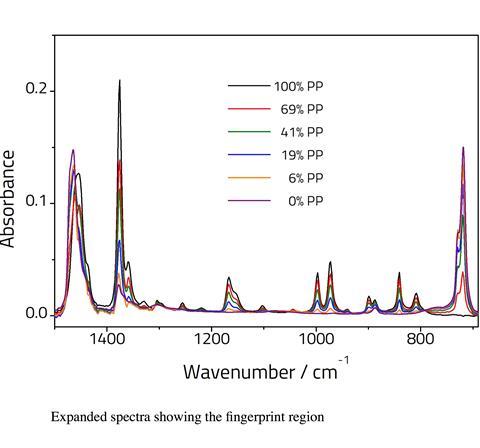
PP has a number of bands between 800–1200cm-1 that are absent for PE. PE has a band at 720cm-1 that is absent for PP. Bands at 1360cm-1 and 1375cm-1, assigned to CH3 bending vibrations are significantly more intense for the PP sample relative to the PE sample. This is due to the presence of a methyl pendant group on each monomer repeat unit which is absent for the PE polymer. The band at 1454cm-1 in PP (assigned to C–H bends) shifts to 1464cm-1 for the pure PE sample. Additional changes are also observed in the C–H stretching region.
It should be noted that ATR is only semi quantitative since sample contact with the crystal will affect the intensity of the peaks. Nonetheless the relative peak intensities can be used for determining sample composition. It is possible to take the ratio of two peaks, one from each compound. However, as the two components will change relative to one another, linearity would only be expected over a narrow range. Therefore, we have modelled the data using PLS regression analysis.
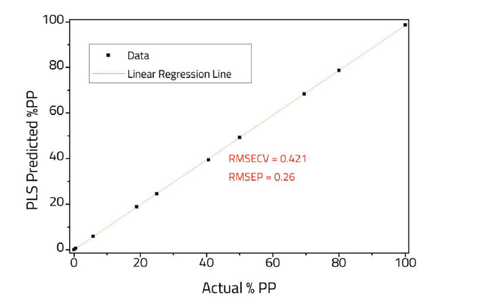
Twelve spectra of variable composition (0–100 % PP) were used to create the proof-of-concept model and then a further 10 spectra of different samples of known composition were used to validate the model. For real world applications further spectra would be required to build a robust model. Two PLS component factors were chosen to fit the data to in order to obtain a good fit Additional components were avoided in order to prevent overfitting.
The comparison of actual PP composition versus the PLS predicted composition is shown in Figure 3. A relatively low root mean standard error of cross validation (RMSECV) and root mean standard error of prediction (RMSEP) were obtained indicating a good fit to the data. Further improvements to the model, particularly for low concentrations of impurities, may be possible using Specac’s constant thickness film maker, however care should be used to ensure that the regions chosen for the model are not over absorbed.
ATR measurements have been used to successfully monitor changes in composition of a PE/PP blend. Chemometric modelling enables the operator to extract the maximum possible information from their spectral dataset. The same technique could be applied to the detection of many different types of impurities in recycled plastics enabling rapid screening via the use of the Quest ATR accessory.
References
1. A Bioncolillo and F Morini, 6 (2018), 576 (DOI: 10.3389/fchem.2018.00576)


No comments yet