Measurement techniques can pinpoint emitters like unroadworthy trucks and broken gas pipes, finds Andy Extance, but are not yet widespread
‘Everybody pays for the sins of a few.’ So says Gary Bishop from the University of Denver, US, who in this case is talking about air pollution – and in 1992, that sinful few included Los Angeles taxi cab companies. Using absorption spectroscopy technology that Bishop helped provide, the local district attorney found that a few taxi companies’ emissions broke legal limits. The suspects were forging certificates showing that their highly polluting taxis passed ‘smog checks’, so that they could carry on without being fixed, Bishop explains.
This behaviour is encapsulated in the economic term negative externality. When we burn petrol to power our cars, for example, the greenhouse gases we emit are a negative externality. Effectively, we’re freeloading, leaving clean-up costs to our future selves and successors. Often this is just normal modern life, but sometimes it’s extreme or illegal. Today, spectroscopic analytical chemistry techniques can detect the worst cases. But there are many complex issues that will determine whether they become solutions in humanity’s struggle to bring pollution under control.
The technology that caught the cheating cabbies is called the Fuel Efficiency Automobile Test, or Feat.1 Bishop describes Feat as similar to an infrared spectrometer found in many chemistry labs, but cut in half. ‘We put the detector on one side of the road and the light source on the other,’ he says. ‘Our sampling cell is the roadway.’
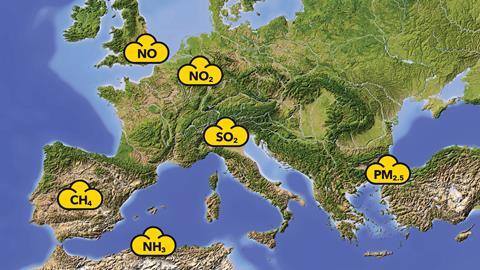
This remote sensing approach needs fast detectors to capture data from exhaust plumes that dissipate in less than a second. Feat uses several detectors, most with filters on that only let light pass through related to spectra for specific pollutants of interest, including carbon monoxide, carbon dioxide and unburned fuel. Feat also exploits disperse UV spectroscopy, where gratings split light into spectra for pollutants – like nitric oxide, nitrogen dioxide, ammonia, sulfur dioxide – over many wavelengths. Spectral fitting routines then calculate their concentrations, Bishop explains.
Our sampling cell is the roadway
Using Feat, Bishop also spotted clues that Volkswagen diesel models were cheating before the company acknowledged using ‘defeater devices’ for emission tests (the ‘dieselgate’ scandal). He recorded measurements in Denver, Los Angeles and Tulsa in 2013, publishing them a month before Volkswagen admitted to cheating.2 His data showed that new ‘cleaner’ diesels had very similar emission profiles to previous models.
While Bishop uses Feat to conduct such one-off studies, it also enables regular vehicle screening. It’s used in Virginia and Texas, and also in Denver, where Bishop says it makes 8–10 million measurements per year. Denver vehicles must typically pass emissions inspections in testing centres every two years. But if a vehicle operating within pollution limits drives past a Feat instrument it will be excused testing, even if it still has to pay a fee.
Hidden culprits
Yet Bishop notes that this scheme doesn’t tackle vehicles that violate emissions regulations, which in Denver are usually simply faulty. He sees this as a missed opportunity. ‘If you’re willing to just deal with the small number of vehicles that are broken, from a cost/benefit point of view it’s tremendous,’ Bishop says. But handling the worst emitters would require careful thought, he adds. ‘You’re going to find that a significant number of [those vehicles’ owners] are either minorities or low income.’
Such issues may contribute to a relatively low uptake for a technology that has been around for multiple decades, and Bishop’s own precarious situation. ‘Right now I don’t have funding to make it through next year,’ he says. Consequently Bishop has lent a Feat device to David Carslaw at the University of York, UK. ‘That’s likely where it will end up for the rest of its life,’ Bishop says.
Since the dieselgate scandal there’s now much more interest in surveillance of vehicles
Europe is very different, with interest in approaches like Feat growing, Carslaw says. ‘We rely much more on diesel vehicles, and the high emitters aren’t broken as such, they’re designed that way,’ he says. ‘And since the dieselgate scandal there’s now much more interest in surveillance of vehicles.’
Volkswagen’s dieselgate tactics underlined that lab tests don’t represent real-world conditions. However, putting instruments on many vehicles gets expensive very quickly, Carslaw notes. ‘To understand the characteristics of vehicles as they’re used, you need to measure lots of them, without interfering with the vehicle too much,’ he says. ‘Remote sensing is an ideal approach – you can measure thousands of vehicles in one day.’
Schemes to catch polluting trucks show what remote sensing can do. Trucks in Europe must inject a solution of urea called AdBlue into their exhaust to keep emissions of polluting nitrogen oxides down. They have devices that prevent their engines starting if the AdBlue tank is empty. However, drivers can buy cheap products that get around this. Carslaw highlights remote sensing projects in Denmark and Spain to identify potential cheats, telling police who to pull over and investigate. Both countries ‘uncovered quite a high proportion of evidence’ of cheating, he says.
Remote sensing may become essential for acting on the strong evidence that vehicle pollution harms people’s health, Carslaw suggests. Interest in coupling remote sensing with annual technical inspections is increasing, he says. However, the technology is not yet well suited for wide deployment. ‘These things aren’t routinely used in the same way as an ambient air pollution monitoring sites, where we have hundreds in the UK,’ Carslaw suggests. ‘The Department for Transport might fund a campaign but not a continued investment.’
Remote sensing technology also enables satellite-based pollution monitoring, explains Riley Duren from the University of Arizona in the US. Duren is also an engineering fellow at Nasa’s Jet Propulsion Laboratory in Pasadena, California, where scientists have exploited the Sciamachy imaging spectrometer on the European Space Agency’s (ESA) Envisat. Using scattered sunlight, its high resolution detectors measure absorption by trace levels of gases. Consequently, Sciamachy data from 2003–2009 revealed the largest source of methane release in the US was in Four Corners, New Mexico.3 Releases from the area’s gas and coal industry approached around a tenth of total US emissions of methane – a more potent greenhouse gas than carbon dioxide – from natural gas.
Seeking resolution
That paper also identified a methane hotspot in California. The state authorities therefore asked Duren and colleagues how these emitters contributed to the state’s methane emissions. Duren notes that for such studies there’s another class of imaging spectrometers beyond ‘global mappers’ like Sciamachy. Aeroplane-mounted instruments like Nasa’s next-generation Airborne Visible/Infrared Imaging Spectrometer (Aviris-NG) enable higher resolution work. ‘In the last five years, scientists discovered that imaging spectrometers are getting good enough sensitivity and precision that they can directly image individual plumes of methane, like the zoom lens on camera,’ Duren says. ‘That’s a game changer.’
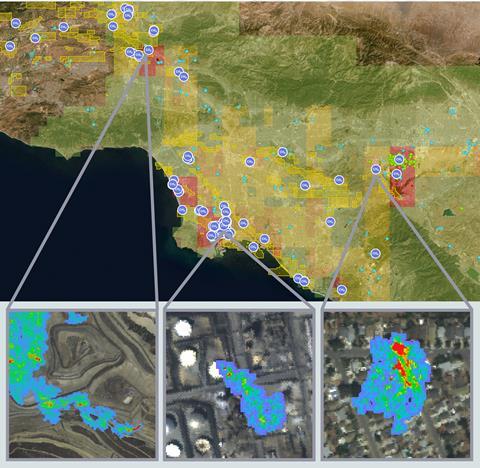
Using Aviris, Duren and colleagues surveyed over 272,000 sites in California from 2016 to 2018.4 They found that 564 point sources, each less than 10m in diameter and mainly at landfills, dairies and oil and gas sites, produced a third of California’s methane output in 2016. ‘That could translate to low hanging fruit for mitigation options,’ Duren highlights. Many ‘super-emitters’ are highly intermittent and random because they’re malfunctions or leaks, he adds, some of which were later fixed.
Measured emissions at super-emitters were very different to what had been reported. And if similar patterns hold true elsewhere, such methane point sources could account for 8–11% of emitted greenhouse gases’ total warming power. Further regional studies with aircraft and the next generation of satellites are needed to check that, Duren stresses, some of which are already funded and some just proposals.
A potentially more accessible earthbound approach to tracking pollutants is tracing fingerprints in ratios between stable isotopes of elements like carbon, oxygen, hydrogen, nitrogen, and sulfur in pollutants. Young-Hee Kim from the South Korean National Institute of Environmental Research in Incheon analyses such fingerprints using isotope ratio mass spectrometry (IRMS) combined with standard analytical separation techniques, like chromatography. She used the approach to find where particulate pollution in her country originates from. ‘During wintertime in Korea, we have very severe air pollution, especially PM2.5, which is associated with adverse health effects,’ Kim says. ‘The origin of PM2.5 has long been the subject of debate.’
Her team collected air samples in highly polluted Seoul, and Baengnyeong Island, which Kim says is ‘the most remote island in Korea’.5 ‘It is the best placed for looking at long-range transport from outside Korea,’ she adds. For this study, the researchers focussed on nitrogen isotope signatures in IRMS fingerprints. They could differentiate PM2.5 originating from local vehicle-related ammonia emissions and coal-based nitrogen oxides transported from outside Korea. Kim’s team found that in Seoul PM2.5 is likely to be related to emissions from coal heating drifting across from China in the winter and local transport in the summer. Throughout the year in Baengnyeong Island, PM2.5 is probably from China.
The origin of PM2.5 has long been the subject of debate
Kim highlights that it’s important to use more than one isotope for finding pollution sources, as isotope ratios of different sources sometimes overlap. She adds that tracking changes in pollutant concentration in different locations can provide another line of evidence for tracking sources. Kim also warns that IRMS can’t distinguish polluters located near to each other. ‘Further studies on identification and profiling of contributing sources are needed to provide more accurate source apportionment,’ she says.
Enforcing climate laws?
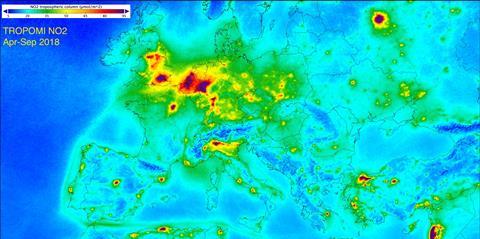
Ground-based data is still of prime importance to environmental regulations, stresses Harry Förster, national projects coordinator at the Netherlands Space Office in The Hague. Yet work is now being done to relate such data to the output of Tropomi, the most capable methane mapping satellite to date, for which Förster is programme manager.
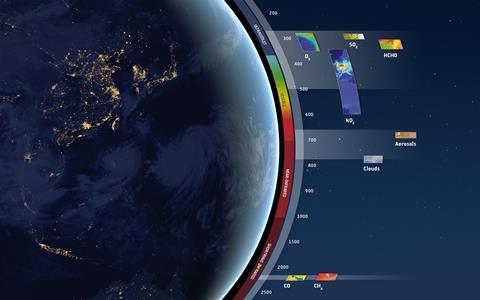
Launched on ESA’s Sentinel-5 Precursor satellite in October 2017, Tropomi scans strips across the planet, recording absorption spectra of gases in the air in reflected and scattered sunlight. Its resolution is 5.5km by 3.5km for nitrogen dioxide, which offers clues where emissions are released. And now scientists are considering reproducing Tropomi’s imaging spectrometers in a squadron of miniature ‘Cubesat’ satellites that will get resolution down below 1km by 1km. That project is currently only at the proposal stage, Förster says, and will just track nitrogen dioxide pollution if it proceeds. Förster calls these capabilities ‘a kind of policing from space’.
Förster says that scientists are ‘flabbergasted by the quality of the data’ from Tropomi, leading to a growing community of users. ‘The strength of Tropomi data is that it provides unprecedented detailed information on pollution and climate change worldwide,’ he says. He notes that it supports government efforts to reduce pollution. In the EU for example, there is an intention to use its data to help enforce the Emissions Trading Scheme (ETS). He calls the current ETS legal framework ‘a barrier’, however, because there is no independent verification of reported emissions.
‘In the EU ETS, regulated installations have to report how much they are emitting,’ explains economist Ara Jo from the Swiss Federal Institute of Technology, ETH Zurich. ‘Installations hire government-accredited organisations to assess their emissions mostly based on energy input and fuel types used.’ Installations must then buy permits via the ETS to cover their emissions. Jo has found that between 2005 and 2015 3.2% of installations failed to buy enough permits.6 This appears to make little economic sense, as the fines for non-compliance are €100 per tonne (£85) of carbon dioxide, while permit prices have never been over €30 per tonne.
But Jo says the EU ETS isn’t enforced enough. Each government is supposed to submit a report on how the regulation has done in their country every year. Of countries that submitted a report for 2005, only three issued penalties to violators, although most countries had violators in that year, Jo says. ‘In Italy, for instance, the Ministry of Environment that’s running the regulation is not legally empowered to impose sanctions,’ she explains. ‘In Germany, they have to wait for the outcome of lengthy court procedures and appeals. The companies that have penalties imposed against them fight back in the courts, and that goes on for years and years, without them being punished.’
So why does anyone buy permits? Jo’s research shows the importance of a country’s culture of trust in whether its companies comply. ‘Companies that operate in places where people trust one another, they’re more likely to be in compliance,’ she says. While trust drives partial compliance, she thinks ‘technology that could remotely measure exactly how much they are emitting could be useful’.
In that context, Förster says that researchers are comparing ETS emission data with Tropomi data. The first results show accuracies ‘within a few percent of the ETS data provided by reliable emitters’. ‘The next step is to convince decision makers in governments and the EU to adopt data from space as an independent means of verification,’ he says.
Whether you favour using IRMS and remote sensing tools like Feat, Tropomi and Aviris to enforce pollution laws may depend on your political outlook. Nevertheless, momentum to minimise greenhouse gas emissions and address the climate emergency is growing. And regulation is only one motivation for using analytical techniques that help achieve that, Duren stresses.
‘For example, in many cases methane has commercial value,’ he says. Maximising income and reducing hazards was effective motivation for companies to fix the leaks Duren’s team found. After Duren and colleagues alerted a southern California gas company to one leak, it ‘showed us a picture of a pipeline and said “This is the cause”,’ he recalls. Duren visualises the stages involved, from satellites in orbit, to aeroplanes crossing the state, pinpointing a ground location. ‘Then ultimately someone comes back and says it was this cracked plastic pipe,’ Duren says. ‘It’s humbling, but also gratifying.’
Andy Extance is a science writer based in Exeter, UK
References
1 D A Burgard et al, Appl. Spectrosc., 2006, 60, 135A (DOI: 10.1366/000370206777412185)
2 G A Bishop and D H Stedman, Environ. Sci. Technol., 2015, 49, 11234 (DOI: 10.1021/acs.est.5b02392)
3 E A Kort et al, Geophys. Res. Lett., 2014, 41, 6898 (DOI: 10.1002/2014GL061503)
4 R M Duren et al, Nature, 2019, 575, 180 (DOI: 10.1038/s41586-019-1720-3)
5 Y-M Park et al, Environ. Pollut., 2018, 233, 735 (DOI: 10.1016/j.envpol.2017.10.072)
6 A Jo, Trust and compliance: evidence from the EU emissions trading scheme, Grantham Research Institute on Climate Change and the Environment, 2019 http://bit.ly/36EREoA


No comments yet