With the climate change debate as heated as ever, how do scientists reconstruct what the weather was like in the past? Jon Evans looks at the detective chemistry behind such environmental forensic work
The Earth is not particularly good at keeping records, especially of its past climate. Like those of a disorganised businessman, its climate records are difficult to find, hard to interpret and often contradictory. But like diligent auditors, scientists are making great efforts to get to the bottom of the Earth’s disorganised records, both to understand how the Earth’s climate behaved in the past and to provide an indication of how it might behave in the future.
Adding to the general disorganisation, the Earth’s climate records are scattered all over the place: in ice cores, ocean and lake sediment, corals, trees, and stalagmites and stalactites, collectively known as archives. They are also in various different forms.
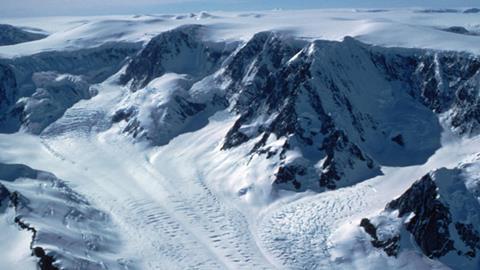
The most straightforward climate records take the form of gases trapped within ice cores. As snow falls and gradually builds up, it captures atmospheric gases such as carbon dioxide and methane. As a consequence, permanently frozen regions where this build-up does not melt away, such as at both poles and the tops of mountains, contain a record of atmospheric gases that can stretch back hundreds of thousands of years.
Scientists have extracted numerous ice cores from the poles and mountain glaciers; one of the longest ever ice cores was extracted from east Antarctica and measured over 3000m, providing a climate record that stretches back 850,000 years and covers the last eight ice ages. The concentration of gases in these ice cores corresponds directly with their concentration in the atmosphere when they were trapped, with the age of the gases increasing with depth.
Although interesting in their own right, historical measurements of atmospheric gases are not that useful if they cannot be linked with other aspects of ancient climates. In particular, scientists want to probe the historical relationship between atmospheric concentrations of greenhouse gases, such as carbon dioxide, and temperature.
Unfortunately, there is no way for the Earth to keep a direct record of its past temperature. The same is true for many other climate-related factors, such as ocean circulation and salinity, wind systems, and biological productivity, which affects the rate at which carbon dioxide is removed from the atmosphere. For historical records of these factors, scientists are forced to turn to chemical proxies.
Detection by proxy
These are chemical markers that not only change in a fairly predictable way in response to some factor of interest but also leave behind a permanent record. They can therefore act as a historical stand-in for the actual factor. So, as well as trapped gases, scientists also look for a wide range of chemical proxies in ice cores.
In the simplest case, the presence of a specific chemical is used to denote a particular climate factor. For example, high concentrations of sulfates in ice cores are a sign of major volcanic eruptions, while sodium concentrations mark the waxing and waning of ice sheets.
More usually, however, scientists are looking for ratios between elemental isotopes, reflecting the fact that different isotopes take part in certain chemical and physical processes at slightly different rates. This can result in the ratio of these isotopes in archives changing in response to environmental factors such as temperature and biological processes.
‘Because the different isotopes are fractionated from each other by processes in nature, like their solubility or their ability to go into different mineral phases, that separation starts the clock for us,’ explains Gideon Henderson, a professor of earth sciences at Oxford University.
Spotlight on oxygen
For temperature, oxygen isotopes in water have been the primary chemical proxy for the past couple of decades. The two most abundant isotopes of oxygen on Earth are oxygen-16 (at more than 99%) and the heavier oxygen-18 (around 0.2%). When water evaporates, water molecules containing the lighter oxygen-16 tend to evaporate before those containing the heavier oxygen-18, while the opposite happens when water vapour condenses, with water containing oxygen-18 tending to condense first.
‘Each time there’s a phase change from liquid or solid to vapour and back again, there’s a fractionation between the different isotopes,’ explains Eric Wolff, science leader of the chemistry and past climate programme at the British Antarctic Survey in Cambridge, UK.
In practice, this means that when sea water evaporates it produces water vapour that is relatively enriched in oxygen-16. This enrichment process continues as the mass of water vapour travels towards the cold poles and starts to condense, because water molecules containing oxygen-18 condense first, falling as rain or snow.
By the time the water vapour mass reaches the Arctic or Antarctic, it has become very depleted in oxygen-18, meaning that the ratio of oxygen-18 to oxygen-16 in snow falling at the poles is very low. This is especially the case if the temperatures are low, because more of the water vapour has condensed by the time the mass reaches the poles, leaving it very depleted in oxygen-18. At higher temperatures, in contrast, less of the water vapour has condensed by the time it reaches the poles, meaning that the snow falling from it is less depleted in oxygen-18. By measuring the ratio of oxygen-18 to oxygen-16, expressed as the d18 O value, in ice cores, scientists can calculate the average regional temperature when the snow fell.
More than ice
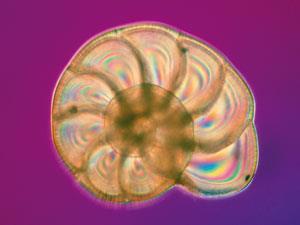
The technique is not just restricted to ice cores. Scientists can also measure oxygen isotopes in the calcium carbonate that makes up stalagmites and stalactites and that is found in ocean sediment, where it is derived from the shells of microscopic marine creatures known as foraminifera.
This allows scientists to determine historical temperatures at a variety of different locations on the Earth, including in the oceans, allowing them to build up a picture of both how the overall global temperature has varied in the past and how temperatures have varied across the globe. Sediment also provides a much longer temperature record: ice cores ‘only’ go back for hundreds of thousands of years, whereas sediment cores can stretch back millions of years.
We really need to be more careful to understand the limitations of the proxies
Other isotopes can reveal a whole lot more information about past climates. The ratio of nitrogen-15 to nitrogen-14 and the ratio of silicon-30 to silicon-28 in sediment can be used to determine past nutrient use and biological productivity in oceans. Because foraminifera preferentially incorporate the lighter isotopes of silicon and nitrogen into their shells and other organic material, surface waters become steadily enriched in the heavier isotopes.
The ratio of boron-10 to boron-11 in ice cores and sediment can be used as a measure of ocean acidity. This is because boron exists as two chemical species in seawater, which differ in relative concentration depending on the pH; one of these species tends to incorporate more boron-10 than the other.
In addition, scientists have found that the concentration of various trace metals, usually expressed as a ratio to calcium, in sediment and ice cores can reveal other climate-related information. For example, the ratio of cadmium to calcium can be used to track ocean circulation, because cadmium acts as a marker for nutrient distribution, which is partly determined by ocean circulation patterns.
Increasing sensitivity
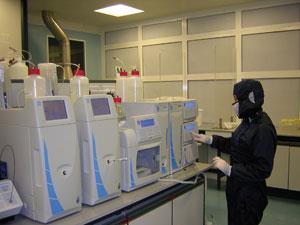
Indeed, scientists are finding more and more chemical proxies for more and more climate factors. Part of the reason for this is the development of advanced analytical instruments that can detect these proxies more sensitively and accurately than ever before. So over the past few years, Henderson and Wolff have replaced isotope ratio mass spectrometry and ion chromatography with inductively-coupled plasma mass spectrometry (ICP-MS) and cavity-enhanced spectroscopy.
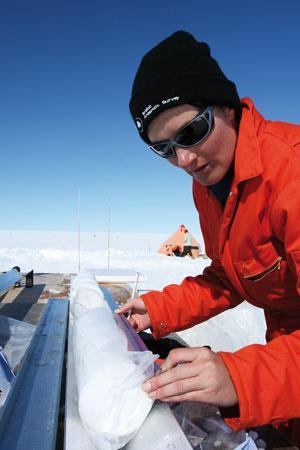
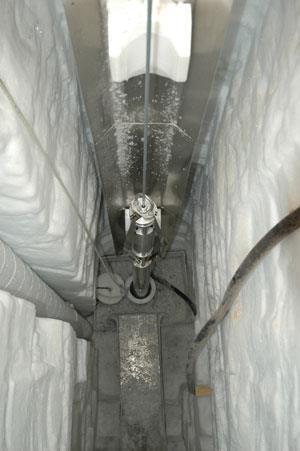
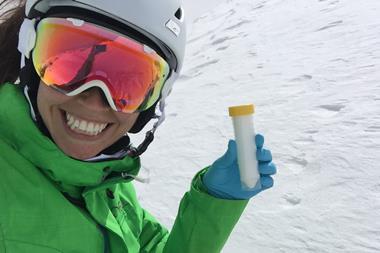
‘In the past, we used to bring back an ice core and chop it into slices maybe every 5cm and then analyse it in the ion chromatograph,’ says Wolff. ‘Now, you take a stick of the ice core maybe a metre long, put it on a hot plate and melt it slowly, and then suck it into these instruments, which are measuring continuously. So we’re just getting much better result data and much faster than we used to.’
This means, however, that the bottleneck in analysing chemical proxies has just moved along a stage. The difficulty now is not in accurately detecting these proxies in ice cores and sediment, but in interpreting what they mean. ‘The analytical step isn’t the one that’s giving us the most error these days – it used to be, but it isn’t now – it’s the interpretation,’ says Wolff.
There are numerous issues complicating the interpretation of chemical proxies. One of the most serious is that, unlike trapped gases, chemical proxies tend to be influenced by several different environmental factors and so do not have a neat, linear relationship with the factor of interest. At times, this can actually be quite useful, because it means a single proxy can be used to monitor more than one climate factor. This is the case with d18 O, which as well as revealing information about past temperatures can also reveal information about precipitation levels.
This is not too surprising, as the whole oxygen isotope fractionation process is built on evaporation and condensation. So low d18 O values can indicate high rainfall and high values can indicate low rainfall, because heavy rain causes the water vapour from which it condenses to become depleted in oxygen-18.
But it also means that d18 O values are not just influenced by temperature. They are also influenced by factors such as evaporation and condensation rates, which themselves depend on factors such as temperature and wind speed, the volume of glacial ice, and the general concentration of oxygen-18 in the oceans, which differs in different parts of the world.
Complicating factors
In order to use d18 O values as a measure of temperature, scientists really need to take account of all the other factors that can influence the values. The same is true for many other chemical proxies.
One option is to measure the same factor using two different proxies, ideally ones that interact with the factor of interest in completely different ways. For instance, in addition to oxygen isotopes, historical temperatures can be estimated from the ratio of calcium to magnesium in ocean sediment, because the rate at which magnesium is incorporated into foraminifera shells varies with temperature.
Ultimately, though, scientists really need to study in detail the precise nature of the relationship between specific proxies and specific climate factors, both now and in the past. ‘Many proxies are not as well calibrated or understood as we would like,’ says Henderson. ‘It’s tempting when you first measure a relationship between a climate parameter and a geochemical parameter to think you can apply it at any time in the past. But we really need to be more careful to understand the limitations of the proxies and when they’re good and when they’re bad.’
Another problem is accurately dating these climate records. Although the age of ice cores and sediment generally increases with depth, scientists usually need to date the record much more precisely. This is especially the case when probing the interaction between carbon dioxide levels and global temperatures.
Ice cores are especially difficult to date. It is usually done by comparing ice core-derived climate records with more accurately dated records or by matching sulfate layers in the core with well-dated volcanic eruptions. Sediment cores and stalagmites can be more accurately dated by monitoring the decay of radioactive isotopes of carbon and uranium.
Finally, despite the ever expanding choice of chemical proxies, scientists would still like to find more. Henderson says that accurate proxies are needed for measuring historical wind circulation patterns and ocean salinity, while Wolff would like to see more proxies for organic material. Fortunately, all the proxies that scientists could ever need may already be there to find in the Earth’s archives.
The latest ICP-MS instruments are able to detect thousands of different molecules in even fairly pristine ice cores, let alone ocean sediment; scientists just need to learn how to use them. ‘It’s a ripe area for exploitation I think,’ says Wolff, ‘but we haven’t got to the point of knowing what most of these molecules are, let alone what they mean.’
Although not particularly conscientious about its record keeping, the Earth does at least keep hold of everything; it’s just a matter of knowing where to look.
Jon Evans is a science writer based in Bosham, UK


No comments yet