
Vibrational spectroscopy’s intuitive insight into molecular structure was initially shunned by chemists
Sitting through a morning of seminars by candidates on the shortlist for a lectureship, several of us were struck by how profoundly chemistry has changed over our lifetime: the sheer volume of data that is pouring out of the myriad instrumental techniques available in our labs. In chemistry there is now a real hunger to adopt new techniques that will probe ever subtler aspects of matter. It is a far cry from the early days when anything other than optical spectroscopy struggled to make headway among chemists, vibrational spectroscopy being a case in point.
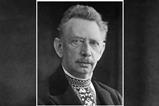
In the second half of the 19th century, spectroscopy and thermal physics began to converge. Physicists began to map out the spectrum of the black body radiation identified by Gustav Kirchhoff. In the infrared part of the spectrum, by Kirchoff’s time the blackened thermometer used by Marie-Auguste Pictet, had been superseded by the thermopile of Leopoldo Nobili and Macedonio Melloni. The thermopile revealed that the diathermancy (transparency in the infrared) of a material bore no relation to its colour, a conclusion underscored for gases by John Tyndall, who speculated that molecular motions must be involved. The much more sensitive blackened platinum wire bolometer developed by Samuel Langley provided a huge step upwards in sensitivity and made it possible to complete the mapping of the solar spectrum – this established the absorption bands that control the temperature of our planet.
The availability of such detectors led a few researchers to start to look at absorption spectra of minerals and even organic molecules at higher resolution. A number of workers in Britain and Germany spotted bands in the region around 3–8µm, which we now call mid-infrared. Their origin was mysterious and the number of bands seemed to increase with molecular size. The suggestion was that infrared absorption therefore reflected molecular weight in a complex way. All this would change when a young spectroscopist at the US National Bureau of Standards set to work to get better spectra.
In the second half of the 19th century, spectroscopy and thermal physics began to converge. Physicists began to map out the spectrum of black body radiation. Realising that the infrared transparency of a material bore no relation to its colour, led to speculation that molecular motions must be involved. The availability of more sensitive detectors made it possible to complete the mapping of the solar spectrum and led a few researchers to start to look at absorption spectra of minerals and even organic molecules. A number of workers in Britain and Germany spotted bands in the region around 3–8µm, which we now call mid-infrared. Their origin was mysterious and the number of bands seemed to increase with molecular size. The suggestion was that infrared absorption therefore reflected molecular weight in a complex way. All this would change when a young spectroscopist at the US National Bureau of Standards set to work to get better spectra.
A lengthy investigation
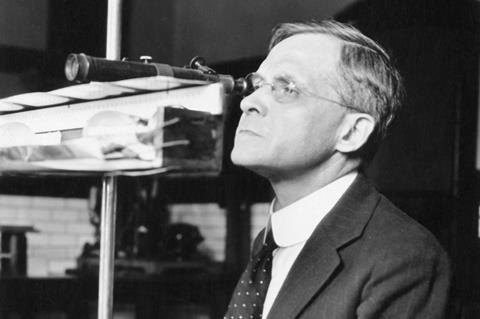
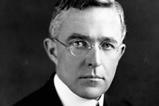
William Coblentz came from a small town in Ohio. After studying at the nearby Case School, he moved to Cornell to do his PhD. The head of department, Edward Nichols, suggested he investigate infrared spectra at longer wavelengths than before. Coblentz set to work. As a source he used a Nernst lamp, an electrically heated piece of ceramic known to give a very smooth distribution of wavelengths. Powered by a battery of 120 cells, the platinum wire inside was soon obliterated to thousands of ‘beautiful microscopic crystals of platinum’. With 90 cells, the lamp worked perfectly, the wires glowing a warm cherry red colour.
The light passed through the sample holder, a pair of rock salt plates sealed with glue or beeswax. After passing through a pair of slits, the light bounced off a curved mirror to a salt prism, protected from moisture by phosphorus pentoxide. Coblentz noted drily that, compared to flames, the electric lamp had the advantage of not producing damaging moisture.
The dispersed light was detected using a radiometer, an exquisitely sensitive device based on a mica vane suspended in high vacuum that Nichols had invented to detect radiation pressure. The deflection of the small mirror on the torsion fibre was observed with a small telescope through a hole in an enclosing box.
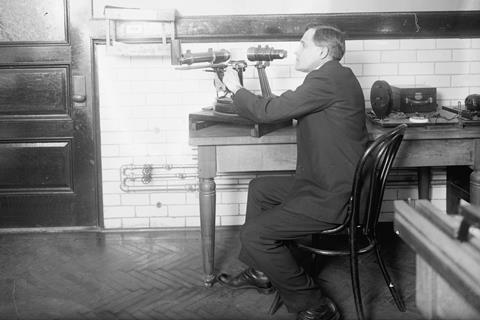
With his spectrometer in place, Coblentz started to look at organic molecules with unprecedented resolution. Each carefully purified sample would be loaded in the cell and the lamp moved progressively to scan through the spectrum between 1 and 3µm. Each spectrum required 40 to 50 measurements. Coblentz had no idea where these measurements might take him. If Ernest Rutherford might have dismissed this as mere ‘stamp-collecting’ Coblentz saw things differently: ‘Experimental observations always have some value. This is not always true of theories which are built, more or less, upon hypotheses and must stand or fall with them.’
Peak performance
As the data built up, patterns emerged. He realised that the molecular weight idea was a complete red herring. Instead, groupings of atoms gave peaks at characteristic wavelengths. At a glance he could distinguish an alcohol from a ketone, an alkane from an aromatic, without the need for slow qualitative organic analysis and derivatisation. Coblentz even showed that some isomeric hydrocarbons, laboriously separated from petroleum fractions by a colleague at Case, gave distinctive spectra – a fingerprinting tool had been born.
Coblentz left no stone unturned – he measured spectra in transmission and in reflection. He even measured the emission spectra of heated minerals, echoing Robert Bunsen and Kirchhoff’s observation of ‘inversion’ of absorption and emission bands. He would later move on to making measurements of the moon and stars.
Yet chemists failed to use the technique. Perhaps it was its association with physics that prevented chemists understanding its potential, along with its ferocious experimental difficulties. Between the world wars, detailed analyses of molecular vibration began to emerge from physics labs and slowly the chemical industries, especially the petroleum refiners began to use the technique to identify the components of their distillations. With the outbreak of the second world war there came a sudden pressing need: to understand where Nazi Germany was getting fuel for its dive bombers and panzers. Infrared fingerprints pointed to Romania and the oil fields of the Caspian sea, one of the reasons for Hitler’s invasion of Russia. Soon companies like Beckmann and Perkin-Elmer began to sell the machines and the technique finally took off.
We all teach infrared spectroscopy – there is an intuitive simplicity in using it to identify organic compounds. But Raman spectroscopy, long its poor exotic cousin, has today supplanted it in many contexts. Both come in numerous variants, combined with mapping, topography and more, the data now an unceasing torrent. Yet the old challenge never changes: what does it all mean?
References
William Coblentz, Investigations Of Infra-Red Spectra, Carnegie Institution, Washington DC, vol 1 1905, vol 2 1906, vol 3 1908.


No comments yet