A new computer program can quantify total and local strain within a molecule in minutes. It generates a heatmap representation to show where a molecule is the most and least strained, and could help researchers better understand phenomena that uniquely affect molecular properties and reactions but are challenging to quantify.
Curtis Colwell from the University of Oregon in the US studies the chemistry of highly strained molecular rings, formed of interconnected benzene fragments, called cycloparaphenylenes. The distorted shapes of these aromatic nanohoops furnishes them with interesting structural, electronic and physical properties. Uneven distributions of strain energy can create unexpected regions of higher reactivity that chemists are keen to understand and harness.
For cyclic systems, strain is the potential energy released upon breaking the ring. Total strain can be measured through combustion calorimetry, but these challenging experiments provide no information on how strain is distributed within the molecule. Computer simulations can provide a high accuracy picture of molecular distribution of strain, but these studies take time and are technically inaccessible to many of the organic chemists who would benefit from the information.
Now, Colwell and his colleagues have developed a free computer program called StrainViz that quantifies total and local strain within cyclic molecules. StrainViz automatically provides a picture of where the strain sits in the molecule as a heatmap. To run StrainViz, all users need are the atomic coordinates of the cyclic molecule of interest, as well as some simple fragments into which it can be broken down.
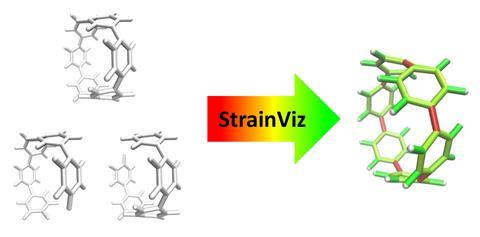
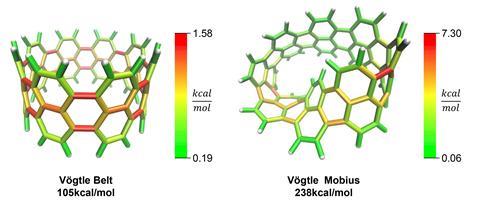
StrainViz performs a series of DFT-level geometry optimisations on the fragments to release and subsequently quantify the strain energy within them. Once quantified, a sum of the strain energy associated with all angles and bonds provides the total strain energy, which is split across bonds to provide the picture of strain on a local level. Prior to StrainViz, computer simulations studying strain energies typically provided angle and bond length-based quantities to demonstrate how strain is distributed. ‘Experts in this field can interpret where strain is in molecules, but for anyone else, it’s really hard to look at a crystal structure or a molecule and see where that would be. By painting everything in colours, it makes it really easy to visualise and communicate that strain,’ says Colwell. Tests found that StrainViz can correctly predict strain energies for a large number of cyclic molecules, including belts, nanoballs, panels and curved aromatic molecules, and can also correctly predict sites of higher reactivity for strain-driven organic chemistry reactions.
‘I think that they’re really doing a good service for the organic community by harnessing these computational tools in a way that is useful for non-experts,’ says Renana Gershoni Poranne, who develops methods and tools for understanding mechanisms and physical properties of organic and organometallic compounds at the Swiss Federal Institute of Technology in Zurich. She adds that the resulting images are an ‘important bridge between physical chemistry and organic chemistry’ and will appeal to the visual nature of organic chemists who use orbital and arrow-pushing diagrams.
Colwell says StrainViz could enable chemists to design reagents to achieve strain-derived reaction outcomes among other things. ‘If you are rigidifying part of a molecule, then you are forcing strain to shift to another part of the molecule. I think that people have never really thought about making molecules from that.’
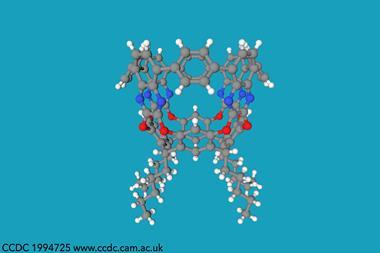
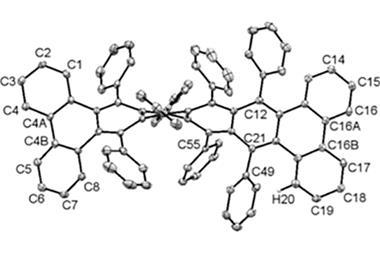
![An image showing a [2]catenane](https://d2cbg94ubxgsnp.cloudfront.net/Pictures/380x253/0/0/4/504004_fja0c01757_0007.jpeg_49119.jpg)


No comments yet