An overhaul of carbon dating has been announced today. The update – the first in seven years – led by an international calibration team (IntCal), not only improves the accuracy of radiocarbon dating, but also lets researchers look 5000 years further back in time, to 55,000 years ago.
The revision tweaks how radiocarbon dates are matched to calendar dates. ‘There are subtle, but sometimes important changes,’ says Paula Reimer of Queen’s University Belfast, who led the IntCal20 effort. The date of the eruption of the Minoan volcanic eruption that destroyed the island of Thera, Greece, for example, now looks like it could have been as recent as 1544BC (although more likely around 1625BC). This puts it potentially closer to historical estimates of around 1500BC made by assessing pottery styles – or potentially much further away. Pinning this down is ‘not just a matter of changing a date in a textbook or museum case, it’s rewriting history’, says IntCal team member Sturt Manning, an archaeologist at Cornell.
Every time there’s a revision people are very excited
Carla Hadden, University of Georgia
Further back in time, the corrections can amount to centuries – such as around 40,000 years ago, when modern man was thought to have been moving into Europe and parts of Asia. A Homo sapiens fossil in Romania now looks to be roughly 300 years older than previously thought, for example, which pushes back the time that Neanderthals and modern humans lived together in that region. Meanwhile the oldest H. sapiens fossil found in Siberia seems to be 1000 years younger than previously thought. ‘If we want to talk about when Neanderthals and Homo sapiens met, the resolution has been so poor it’s like saying you met Julius Caesar,’ laughs IntCal contributor Sahra Talamo of the University of Bologna, Italy. ‘Now it’s much better.’
Oregon State University geophysicist Maureen Walczak, who studies the retreat of ancient ice sheets as recorded in marine sediments, says in her line of work there’s ‘nothing more important than a solid handle on the absolute timing of globally distributed events’. The 2020 revision is ‘really exciting and will support transformative insights into our dynamic climate system’, Walczak says.
‘Every time there’s a revision people are very excited,’ says Carla Hadden, an archaeologist at the Center for Applied Isotope Studies at the University of Georgia, who was not part of the effort. ‘I’ve been waiting every day … is it out? Is it out? Is it out?’
Dating the past
The fundamental principle behind radiocarbon dating is simple: plants – and by extension animals – take in carbon from the world around them, including a natural amount of radioactive carbon-14. When a creature dies, that absorption stops, and the carbon-14 starts to decay. By measuring the amount of carbon-14 left, researchers can calculate how long ago the creature died. The technique is used on everything from human bones to clothing, wood and seashells.
But there are complications. The amount of carbon-14 in the air is not constant: it goes up, for example, when the Earth’s magnetic field is weak and more cosmic rays enter the atmosphere, creating more carbon-14-loaded carbon dioxide. There are hemispheric and seasonal blips in carbon-14, and different tree species absorb more carbon at different times of year, affecting their carbon uptake. The ocean also absorbs carbon from the air but then circulates it, so that sea creatures may absorb carbon from centuries ago.
To track these blips, researchers match radiocarbon measurements against other measures of time, including tree rings, and uranium/thorium dating of corals and cave stalagmites. These datapoints are used to create calibration curves matching radiocarbon dates to calendar dates for three different regions: the northern hemisphere (IntCal), the southern hemisphere (SHCal) and marine samples (Marine).
The 2020 update nearly doubles the amount of data from the previous effort in 2013.
Precise calibration
The rate and precision of data collection has gone up dramatically thanks to accelerator mass spectrometry (AMS) to measure carbon-14, a technique that requires far less material than traditional techniques. With AMS, ‘dates have become 50% to 100% more accurate than just 10 years ago’, says Manning, and required sample sizes have dropped from the size of a book to a matchstick. Smaller samples also means that the radiocarbon is more likely to come from a single year rather than a decade. While some labs, like Hadden’s, use multi-purpose accelerators that fill a room and require a particle physicist to ‘keep them happy’, a boom in data has resulted from the use of smaller machines.
Greater precision allowed the team to use samples such as trees preserved in New Zealand bogs, which can be 40,000 years old. The new calibration was pushed further back by including data from marine sediments from Venezuela, which go back 60,000 years, and a stalagmite record from Hulu cave in China that goes back 54,000 years.
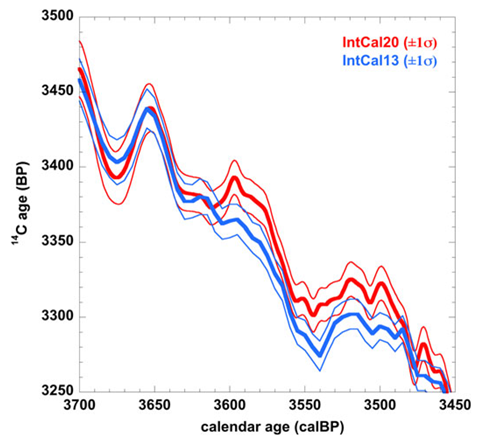
The calibration is also aided by a new statistical method to connect the dots. The team pinned important and well-known data points such as Miyake events – periods when something like a supernova led to large increases of carbon-14 in the atmosphere in just a few years – and used a different statistical technique to the last calibration to draw a line through the remaining datapoints. The result is a smoother curve than in 2013, which researchers believe better matches the reality of radiocarbon in the air. ‘It has changed quite dramatically,’ says IntCal statistician Tim Heaton from the University of Sheffield. ‘We’re not so influenced by outliers.’
The end result better captures, for example, an incident 40,000 years ago when a drop in the Earth’s magnetic field resulted in more carbon-14. The 2013 curve’s carbon-14 peak for this event was too low and too old by 500 years, says Reimer. That has been fixed.
Adding more data also, ironically, has created a wider error bar for some parts of history, because some labs and tree records disagree with each other. ‘Greater precision has created greater uncertainty, you could say,’ says Manning. ‘If you throw more and more evidence in, you end up with more noise.’
In some spots, the calibration line flattens, or moves around a lot, creating multiple possible answers for the same radiocarbon reading. For the Minoan eruption on Thera, for example, the more detailed curve around 1500–1600BC now provides five different possible date ranges for the timing of that event.
There is still room for improvement though. Manning argues that there are already some high-precision datasets that show regional differences not covered by IntCal’s whole-hemisphere approach. ‘About half the group agrees, and half doesn’t,’ he laughs. ‘Of course, the next curve will be even better. It’s an iterative thing.’


No comments yet