Making crystallography an order of magnitude more fun
Every year I find myself having to lead a set of tutorials about x-ray crystallography, a topic that, I confess, I’ve never felt very comfortable with. One of the questions requires students to calculate the structure factors of a set of reflections. The summation of sines and cosines takes a little care and patience; not surprisingly the question produces a certain grumpiness among the students. While trying to restore morale, I sometimes find myself having to avoid sounding like the four Yorkshiremen sketch. ‘We’d have been glad of the price of a cup o’ tea then…’
Since a modern diffractometer collects and processes a complete dataset largely automatically in a couple of hours, it is hard to appreciate just how brutally hard and repetitive crystallography was before the advent of computers. Data collection using the Braggs’ ionisation spectrometer (Chemistry World, December 2013, p37) was exquisitely slow. The intensity of hundreds of spots on x-ray photographs would then be estimated by eye using a small magnifier and transcribed to a notebook. As to processing, that was a different ball-game altogether.
Unlocking the unit cell
Initially Lawrence Bragg considered crystals as containing point atoms that scattered x-rays in proportion to their atomic number; in-phase scattering gave intensity at particular angles. This was done without a precise knowledge of x-ray wavelengths; it was only by combining scattering data with the density of high symmetry substances like zinc blende that both structures and wavelengths were established.
As the complexity of the structures increased it became clear that identifying the unit cell required unravelling the intensities of the diffracted x-rays. In 1915 William Henry Bragg, Lawrence’s father, suggested that the solution must lie in using Fourier series – sums of sines and cosines weighted in proportion to the atomic number – to calculate the amplitude of the x-rays travelling through the crystals. In 1928, Lawrence showed how the method could be used to solve the structure of the silicate diopside whose structure was already known.
Around this time, two graduate students in Liverpool, Cecil Beevers and Henry Lipson, were assigned to work on X-ray crystallography and they attempted to determine the structure of triclinic (ie low symmetry) copper sulfate. Ironically, Liverpool did not have the equipment to do this so the pair wrote to Lawrence Bragg in Manchester for help. Bragg invited them to use one of his old ionisation instruments. The two students would travel 40 miles to do their measurements (Beevers by bicycle to save the rail fare) and then return to Liverpool to continue their analysis – a task which they gradually realised would take them years to complete.
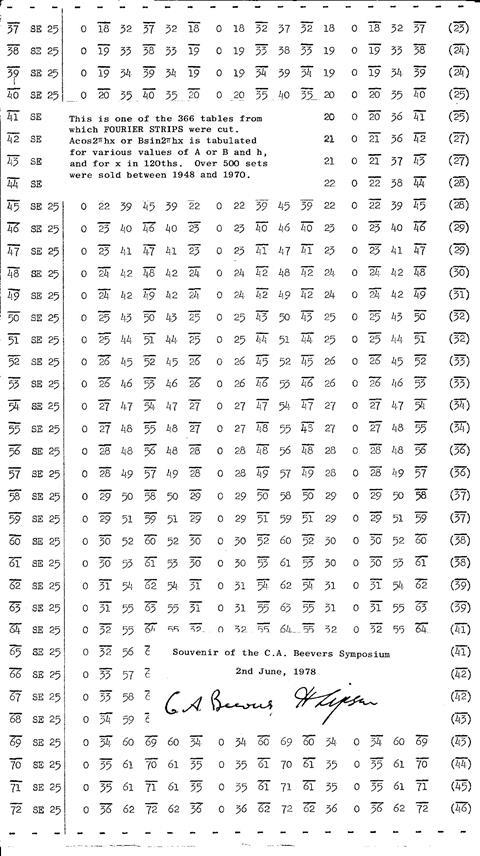
Then Lipson had a brain-wave. Taking the Fourier series for a particular set of planes, the equations could be rearranged to first separate the x and y components, and then split the sines and cosines into separate sums. From this one could calculate a complex lookup table consisting of strips for each value of the amplitude and for different values of the Miller indices h and k. Each strip of paper listed the 16 calculated values, corresponding to a sweep across one-quarter of the sphere of reflections. In order to arrive at the electron density, the values on the appropriate strips would be used as coefficients for a further set of summations that eventually revealed the electron density across a slice of the crystal.
If the preceding description is impenetrable it is just an indication of just how profoundly abstract is the science of crystallography. And even with this simplification, keeping track of the calculations required exceptional mental agility and patience worthy of a Carthusian monk. But crucially the strips reduced the number of calculations by almost an order of magnitude.
Kitchen table science
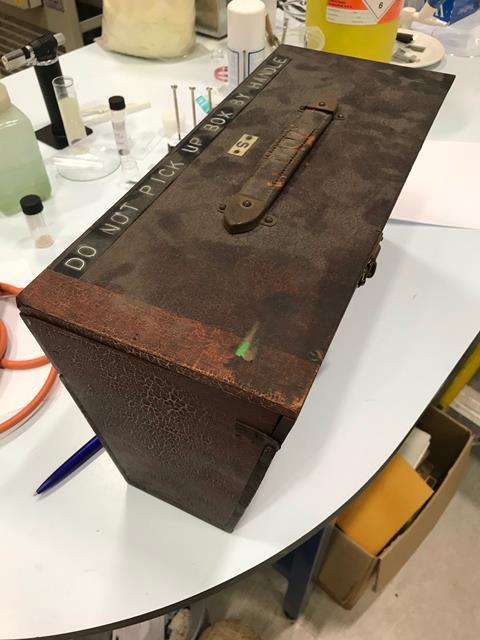
Lipson calculated and compiled an initial, incomplete set of strips with the help of his mother in their kitchen. He and Beevers filled in the remaining strips as and when they were needed and published the method and the solution to the structure of CuSO4.5H2O. The method attracted immediate interest and the pair began to receive requests for copies of the strips. With the help of a £200 loan arranged thanks to the intervention of Lawrence Bragg, Beevers and Lipson printed a complete set of strips housed in two identical boxes, one for the sines and one for the cosines. Several hundred sets were sold and were used from the mid-1930s until computers began to take the tedium out of structure solution and refinement.
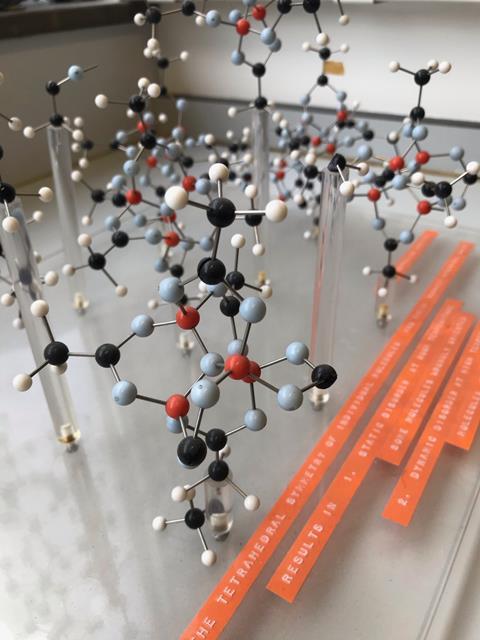
Lipson ultimately became professor of physics at Manchester. Beevers moved to Edinburgh as a research fellow in crystallography and recompiled the strips with the higher resolution of 3˚ (32 steps per strip). He also set up a charitable company that employed a disabled workforce to make ball and stick models of molecules and crystal structures.
A few months ago, a colleague alerted me to a box that was being readied for disposal. Inside it were crystal structure models of beryllium acetate and dimethyl tin chloride dating back to the 1970s, built from sheets of Perspex and ‘Beevers’ balls’. As I brought them back to the department some students looked at them in wonder: ‘That must have been sooooo much work’. I bit my tongue to stop myself saying, ‘In them days they was glad for the price of a cup of tea…’
Acknowledgment
I am grateful to Jeremy Cockroft, Krešo Bučar and Rob McMeeking for advice and inspiration.
References
C A Beevers and H Lipson, 1934, Phil. Mag., 17, 855 (DOI: 10.1080/14786443409462442)


No comments yet