


The venerable chart of elements has inspired and entertained in its first 150 years. Hayley Bennett looks at some of its weird, wacky – and wise – incarnations
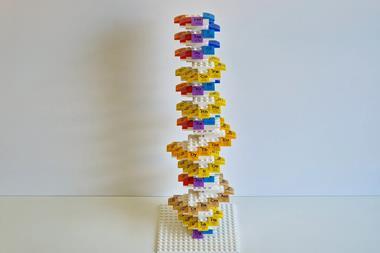
It doesn’t take a genius to impress the internet’s science scene. All you need is a kitchen and a copy of the periodic table. Then there’s the small matter of baking, icing and systematically labelling 118 cupcakes, one for each of the elements. Your ‘periodic table of cupcakes’ will almost certainly be rewarded by an avalanche of likes, upvotes, reposts or whatever your preferred social currency is. Turning anything into cupcakes makes it more palatable, of course, but the fact that one of these tempting tables, created by a chemical engineering student called Rachel in 2012, has been viewed over half a million times says something about the periodic table and what it symbolises.
‘It’s become a cultural icon,’ says chemical philosopher Eric Scerri of the University of California, Los Angeles in the US, who has written several books about the periodic table. He notes that its best known configuration – the one we’re familiar with from chemistry textbooks – has been repurposed to classify fruits and vegetables, swear words and even jazz musicians. ‘Everything you’d care to mention,’ he says. Meanwhile, as a system for organising chemical elements, scientists are still debating the layout. Constructing a periodic table to satisfy the keen eye of a chemist is an art as much as a science.
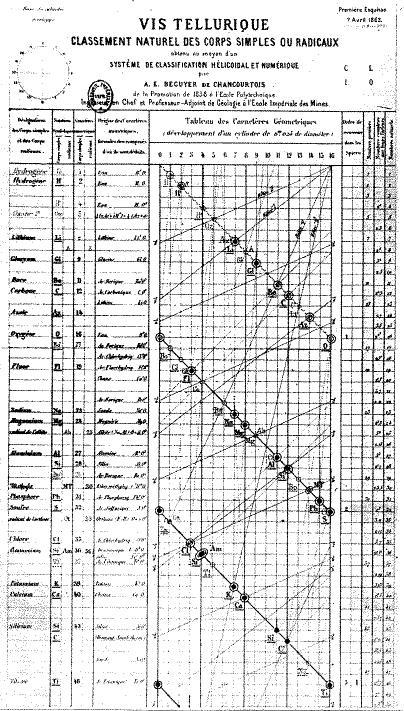
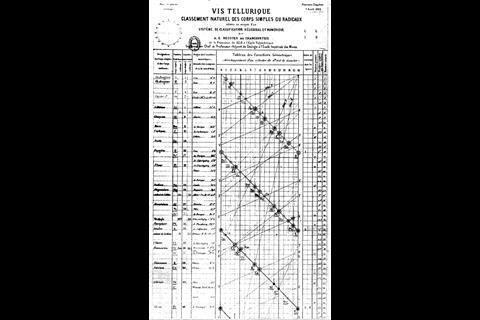
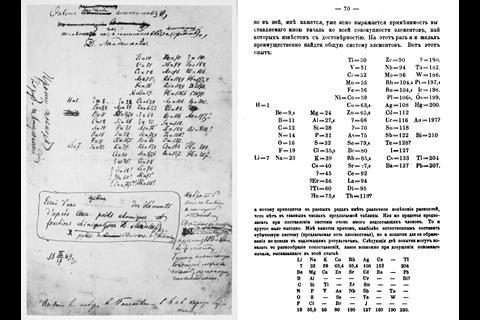
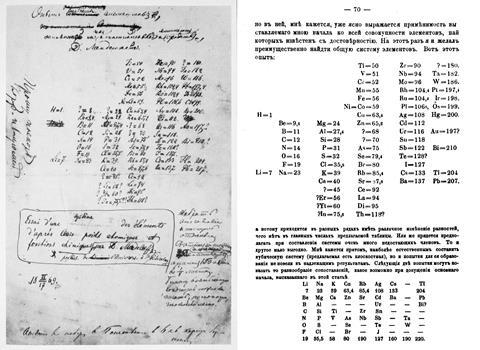
Its conception is, of course, attributed to Dmitri Mendeleev, the Russian chemist whose moment of genius 150 years ago we are celebrating with the International Year of the Periodic Table. But over the last century and a half, it has seen some bizarre and occasionally beautiful reimaginings. Even before Mendeleev scribbled his first draft in 1868, the French geologist, Alexandre-Emile Béguyer de Chancourtois, formulated his vis tellurique, or ‘telluric screw’, a graph of the elements with tellurium at its centre that he displayed on a cylinder. The graph looked more like a nautical chart than a table of elements, but it had a lot in common with Mendeleev’s version. De Chancourtois arranged the elements in order of their atomic weights and recognised that certain properties recurred in regular intervals – mirroring the periodicity that Mendeleev displayed in the rows of his table. Wrapping it around a cylinder produced vertical lists of similar elements akin to Mendeleev’s groups. Sadly for de Chancourtois, the need to view his system in 3D and being published in a geology journal meant it never caught on among chemists.
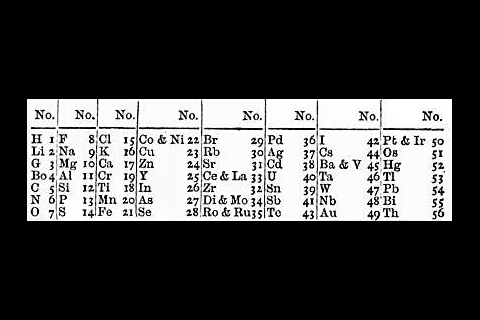
Earlier still, German chemist Johann Döbereiner had grouped the elements into threes, based on their atomic weights. In each group of three, the weight of the middle element was approximately the average of the other two. As Scerri explains, using atomic weight meant these ‘triads’ weren’t exact, but Döbereiner was still able to place bromine between chlorine and iodine, and sodium between lithium and potassium as early as 1829. ‘With atomic number, which is now the ordering principle, those triads are exact,’ says Scerri. Atomic numbers weren’t discovered until after Mendeleev’s death, though, so his first tables showed some elements in the wrong order based on atomic weights. He did correct these, but only based on the patterns he saw in their properties.
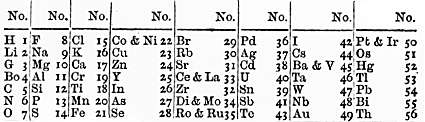
At around the same time as Mendeleev, German chemist Julius Meyer and UK chemist John Newlands were both attempting to organise the elements into tables. Newlands came up with his ‘law of octaves’, imagining the elements arranged on a musical scale, with the eighth note echoing the properties of the first, like returning to C at the top of the C major scale. His ideas were repeatedly dismissed, however.
Going loopy
It was between Mendeleev’s first and final drafts that element-arranging really took off. Following in the footsteps of de Chancourtois, many chemists attempted to perfect the spiral configuration. According to Peter Wothers, director of studies in chemistry at St Catharine’s College in Cambridge, UK, it’s ‘particularly pleasing’ for a chemist to see the elements in a spiral conformation because it keeps their atomic numbers in order, in one long, unbroken string. Though in Mendeleev’s day, there was only atomic weight to go by.
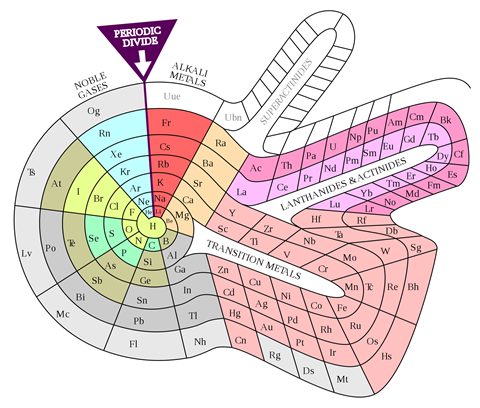
Today, we rarely see the elements so well-ordered as they are in a spiral because, besides having to read from left to right and back again across the periodic table, modern chemistry textbooks generally condense it to an 18-column form, which relocates the lanthanides and actinides to a floating box at the bottom. According to Scerri, the 32-column version that leaves them between the transition metals is a definite improvement. ‘There, every element is in its rightful place in terms of atomic number,’ he says. ‘It’s more philosophically sound.’ But for textbooks and wall displays, he concedes, the 18-column one is more practical.
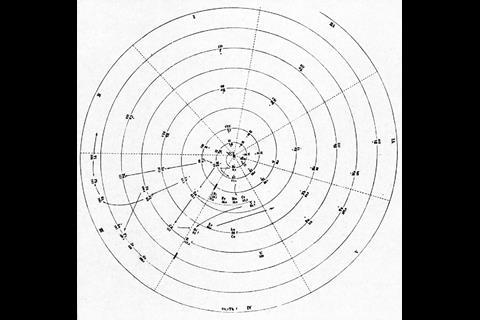
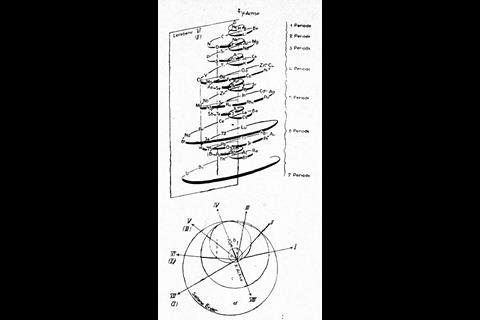
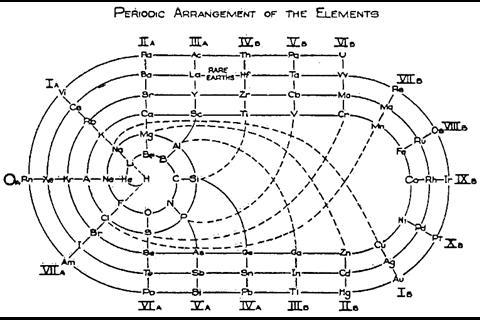
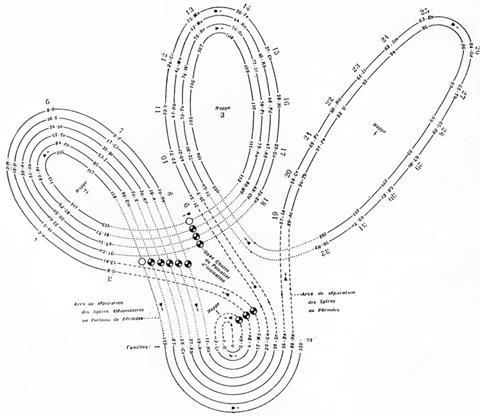
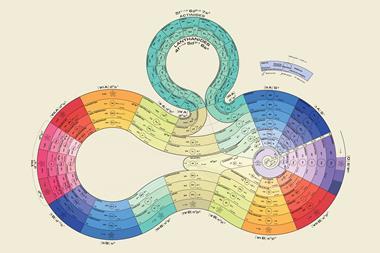
A spiral configuration, like German chemist and mineralogist Heinrich Baumhauer’s 1870 effort, is a more compact way of keeping the elements in order and even Mendeleev agreed that it was a more elegant solution. ‘In reality the series of elements is uninterrupted, and corresponds, to a certain degree, to a spiral function,’ he wrote. He just didn’t like the fact that there was no equation to base the shape of the spiral on. Baumhauer, and Swedish geologist Axel Erdmann (in 1902) created cobweb-like designs with the elements spinning out from a central hydrogen. But while they tried to line up similar elements in the successive coils, they didn’t get it quite right. Baumhauer realised this and resorted to drawing arrows all over his try to solve the problem.
With the advent of atomic numbers in 1913, courtesy of UK physicist Henry Moseley, and Danish physicist Niels Bohr’s theories on the structure of the atom, the periodic table took on new meaning and there were more accurate attempts to spiralise it. Now, chemists knew that each element had its own unique number of protons at the centre of its atoms, but that surrounding these central protons, all elements had the same, standard-sized ‘shells’ for filling with electrons. It turned out that groups of similar elements in the table had the same number of electrons in their outermost shell. The length of different blocks within the rows came to represent the number of spaces available in the shells and their sub-shells. Thus, in a sense, periodic spirals took on the form of the atom itself.
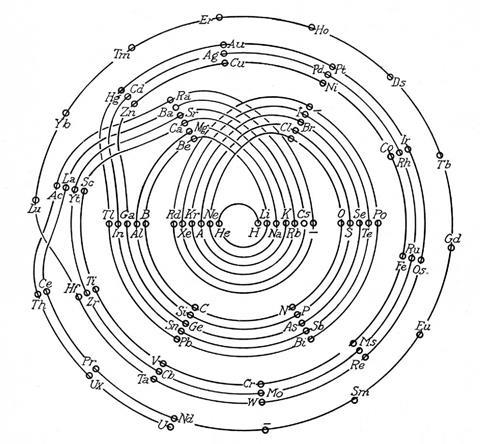
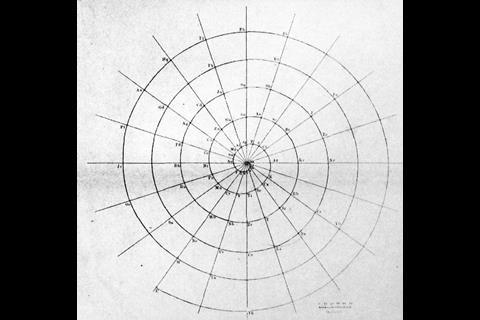
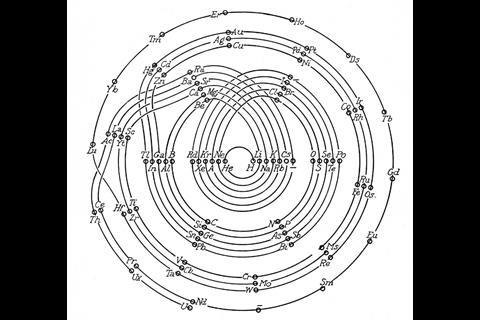
As US chemist Ingo Hackh first showed in 1914, different-sized periods could be accounted for with different-sized coils. In 1926, C J Monroe and W D Turner of the Missouri School of Mines in the US developed a more complex circular periodic table based on electron configuration. Spiralling out in increasingly larger loops from the central hydrogen, each circuit covers an electron shell or set of sub-shells, returning to the centre on a noble gas and heading back out for another loop with an alkali metal. ‘The advantage is gained that one period follows another in continuous progression without the necessity of any artificial discontinuities,’ they wrote in the accompanying paper. It does, admittedly, get a bit fiddly around the start of the lanthanides and actinides, but crucially their correct and unbroken order is maintained with respect to atomic number.
A step too far?
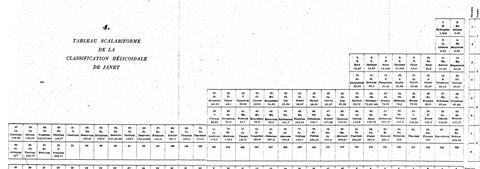
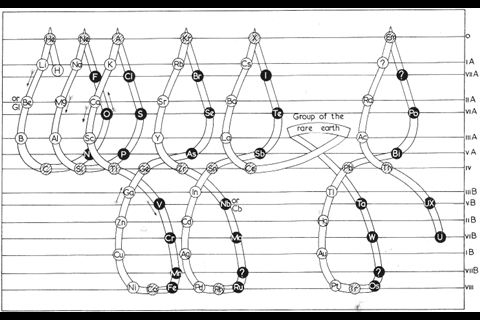
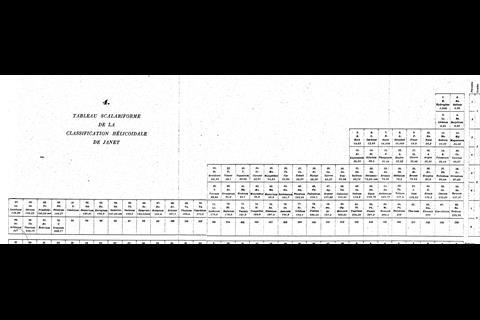
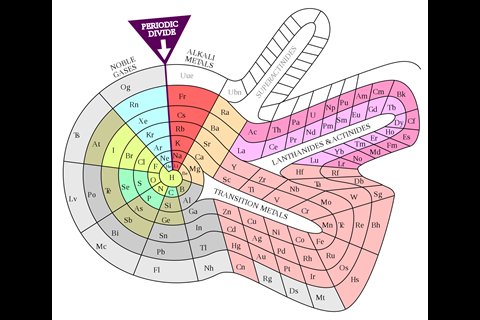
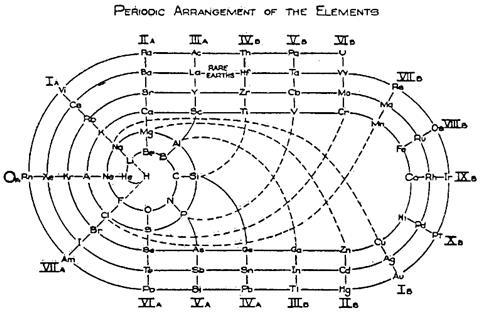
While chemists were getting carried away with coils, another branch of element-arrangers pursued a different idea. They were physicists, intent on incorporating newly developed quantum theory into the table to make it more ‘correct’ in terms of electron configurations. Bohr’s own version was perhaps too much of a departure from the conventional table to interest most. But Charles Janet, a wealthy amateur French scientist who’d made his money in his father’s brush business, pieced together something that, at least among some physicists, has proved marginally more popular. Scerri is also a fan. ‘That, to me, is the real McCoy. It’s a more pleasing shape, more aesthetically satisfying, but also it’s more correct.’ In Janet’s ‘left-step’ table, the organisation is all about electron shells, resulting in helium being placed, controversially, at the top of group 2, on the basis of its having two electrons in its outermost shell. To counter this objection, Scerri himself has since offered up his own table, which incorporates aspects of the left-step table but preserves helium’s traditional position in group 18, with the noble gases.
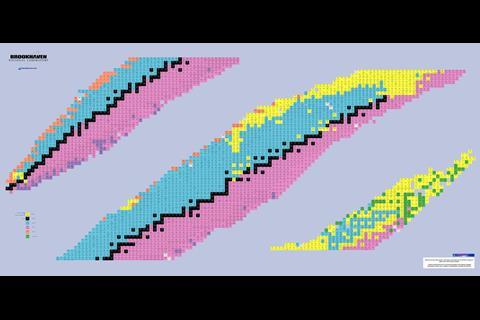
Since then, physicists have continued trying to make a theoretically more complete periodic table in the form of the ‘chart of nuclides’, a chart that not only includes all the elements, but all of their stable isotopes and radioactive forms as well. Those who thought a 32-column table was impractical for a wall chart may not be enamoured with this version either.
Form and function
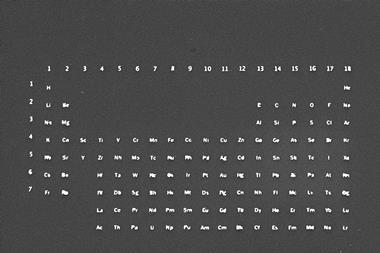
By 1942, Glenn Seaborg at the University of California, Berkeley, in the US had constructed the periodic table that we’re familiar with today, expanding it with plutonium just before joining the Manhattan atomic bomb project. He’d later discover a whole slew of heavy elements to complete the actinides. To some, Seaborg’s version is quite simply the best. Mark Leach, a chemist who has been ‘collecting’ periodic tables for 14 years at his website meta-synthesis.com, is one of them. ‘I personally think the best formulation is the classic one,’ he says. Leach’s collection extends to hundreds, including some ‘really nutty ones’ that nevertheless look ‘very pretty’.
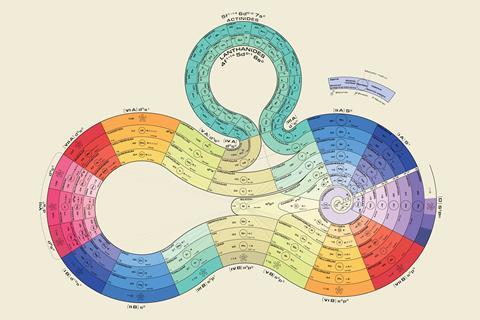
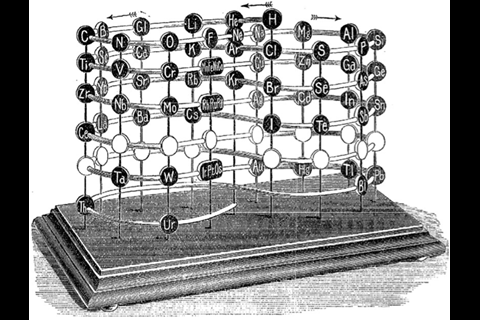
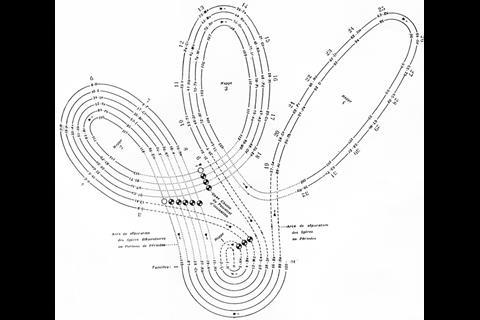
There are, however, still plenty of tables that strive towards a sound theoretical basis, often by redoing the spiral configuration. From the pre-war period, Leach’s artefacts include Janet’s helicoidal ‘Lemniscate’ formulation of 1929, which is not dissimilar to Monroe and Turner’s circular chart. Continuing with the same theme – of looking like an athletics track that has seen Christopher Nolan’s film Inception – there’s Romanoff’s figure-of-eight formulation from 1934 and, later, some striking full-colour versions. US science-fiction writer and chemist John Clark’s 1933 design is beautifully retro in its 1949 reworking for Life magazine, while US industrial silicone chemist Franklin Hyde’s 1975 ‘Periodic Relationships of the Elements’ marries silky smooth turns with richness of information. Its central focus on silicon was to Hyde’s taste, if not everyone else’s. For educational purposes, though, German-born US historian of science Theodor Benfey’s 1960 ‘periodic snail’ offers a clearer take on this theme and even leaves gaps for the undiscovered ‘superactinides’.
In all this rearranging, has function been sacrificed for form? Perhaps in some cases, but to Scerri’s mind, function as a concept is ‘rather grubby’ anyway and too focused on applications. Instead, he suggests, those who dedicate their time to improving the periodic table strive for symmetry and elegance – aspects of aesthetics – because if it’s more elegant, it’s probably more correct. ‘Aesthetics is more related to understanding, deep theory and philosophical satisfaction,’ says Scerri. ‘So it’s not a matter of function – on the contrary.’
By 1957, there was enough variety in the art of rearranging elements for Latvian-born chemist Edward Mazurs to author an entire book on the subject. Types of Graphic Representation of the Periodic Systems of Chemical Elements did what exactly what it said on the cover and was hand-illustrated with 700 or so periodic formulations under 146 classifications. Like Scerri, Mazurs favoured the left-step table and designed more than one of his own in this vein.
Off the page
Whilst most periodic system enthusiasts are satisfied with rendering their designs in two dimensions, others feel that three are necessary, and some have gone as far as to create models, cut-outs and artworks. Monroe and Turner’s 1926 spiral was actually an early example of this – their 2D circular design was actually a ‘base projection’ of a rather ugly model made from enamel discs labelled with the elements, on sticks. Even earlier, in 1898, UK spectroscopist William Crookes used atomic weights of the known elements to order his vis generatrix, a similar concept, but neater and with a lot of blank discs. In 1911, UK radiochemist Frederick Soddy – who discovered that elements have isotopes – drew 3D teardrop-shaped loops to create a rather an unusual-looking periodic system.
In 1948, around the time that Seaborg was busy discovering most of the actinides, physicist George Gamow published his ‘wound ribbon’ formulation in his book One Two Three… Infinity. It showed the elements on a ‘cylindrical band’ or bands, which could be made from several scraps of paper. The problematic lanthanides formed a smaller band looping out from the main table, thus maintaining both the conventional Seaborg look as well as the unbroken chain of atomic numbers. US science museum exhibit designer Roy Alexander’s 1965 take on this arrangement is now sold as a teaching aid – or desk-tidy.
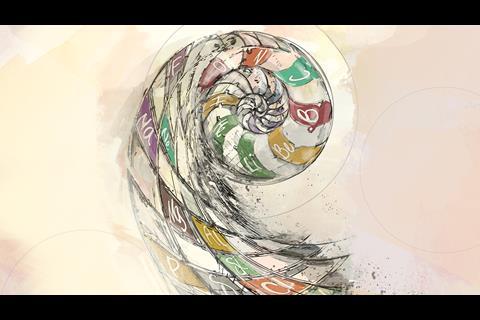
This year, for the 150th anniversary of the periodic table, Wothers commissioned a shiny, new periodic spiral sculpture to go on display in St Catharine’s. Based on a 1920 design by George Schaltenbrand, it incorporates a five-metre long ribbon of silver and 118 tiles fixed in order of their atomic number, with elements in the same groups neatly lining up. What’s more, gold’s tile is made of gold, palladium’s is made of palladium, and, in recognition of the left-step controversy over helium, its tile occupies a position equidistant from group 2 and group 18. ‘What’s interesting is that everyone who has seen this has said it’s just so beautiful – chemists and non-chemists,’ says Wothers. Its intricacies, though, will no doubt be appreciated by the same kind of person who revels in a periodic table of cupcakes.
Hayley Bennett is a science writer based in Bristol, UK.


1 Reader's comment