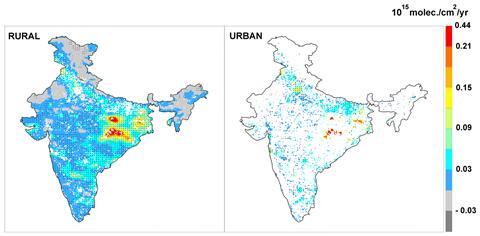
An analysis of satellite data shows that, on average, rural areas account for 41% of India’s nitrogen dioxide pollution. In some cases, rural pollution levels are nearly equal to the levels observed in urban areas. ‘We usually think atmospheric pollution exists only in cities,’ explains Mansi Pathak, from the Indian Institute of Technology Kharagpur. ‘However, our analysis suggests that it is high time to shift our focus to rural regions and examine the pollution levels and health of rural India. This is of paramount importance for a country like India, as we have about 67% of the country’s population in its rural areas as of 2020.’
NO2 is a key atmospheric pollutant known to have an adverse effect on public health. Regular exposure to NO2 is linked to an increased incidence of acute respiratory illness in children and other vulnerable groups.
Pathak and lead researcher Jayanarayanan Kuttippurath used satellite observations ranging from 1997 to 2021 and Edgar inventory data from 1970 to 2018 to understand the distribution and sources of NO2. To conduct the analysis, the team compared the NO2 data with the location of rural and urban regions.
‘Delineation of urban and rural regions was the difficult part of the study,’ says Kuttippurath. ‘Previous studies used nightlight data [obtained using a satellite instrument that collects images in both the visible and infrared light spectra] for this. However, we have used two additional parameters, land use land cover classes [for example croplands, built-up areas, water bodies and forests] and population data, to separate rural and urban regions. This, therefore, is a refined and more accurate approach to differentiate the rural and urban areas.’
The duo concluded that air pollution in rural India is as much of a concern as it is in urban areas. Their major finding was that rural NO2 pollution accounts for 41% of the country’s total. They also note a difference in the sources of urban and rural NO2 emissions. In rural India, road transport is the primary source. However, in urban areas, the power sector was found to be the major contributor to rising NO2 levels.
Srinidhi Balasubramanian, an air quality expert at IIT Bombay, comments that the study ‘successfully provides evidence for urban–rural linkages – a continuum in terms of spatial distribution, but disparate in terms of source contributions.’
The researchers also highlighted that high NO2 levels occur in areas with high populations. This led them to propose that population-weighted averages would be a better indicator of NO2 pollution exposure than spatially averaging NO2 across a region. In accordance with previous studies, the team determined that the lowest NO2 levels were observed during the monsoon season whereas the highest were recorded during winter.
‘It is important to provide explicit scientific evidence of how pollutant and sector contributions vary in rural versus urban areas,’ says Balasubramanian ‘This way local and state level stakeholders, especially regulators, can help identify actionable policies. This study is an excellent example of the same.’
References
M Pathak and J Kuttippurath, Environ. Sci.: Processes Impacts, 2022, 24, 2437 (DOI: 10.1039/d2em00293k)


No comments yet