An IBM team has used atomic force microscopy to reveal the lengths and orders of C–C bonds in buckyballs and polycyclic aromatic hydrocarbons
The order of multiple bonds can be uncovered using atomic force microscopy (AFM), according to Leo Gross of IBM Research in Zurich and his co-workers.1
Bond order doesn’t merely refer to single, double and other multiple bonds. In some molecules, particularly those with aromatic and delocalised bonding, non-integer bond orders can be assigned by taking into consideration different ‘resonance’ structures – the carbon–carbon bonds in benzene, for example, have a bond order of 1.5. Gross and colleagues found that the order of bonds in planar molecules imaged with the AFM correlates with the brightness of the bonds in the image, which is a measure of the force between the bond and the probe tip. What’s more, the apparent bond length in the images is related to the bond order: higher-order bonds are shorter, as one would expect.
In 2009 Gross’s team found that by attaching a single carbon monoxide molecule to the AFM tip, the resolution could be enhanced to reveal the framework of a planar molecule such as pentacene.2
On closer inspection of those images, the researchers saw something more. ‘In pentacene we realised there were differences in the imaging of bonds,’ says Gross – some were brighter than others. They made calculations of electron density using density functional theory (DFT) and realised that these differences could be revealing bond order. So they decided to look at molecules for which there are clear differences in C–C bond order: C60 and some large polycyclic aromatic hydrocarbons (PAHs).
Buckyball bonding
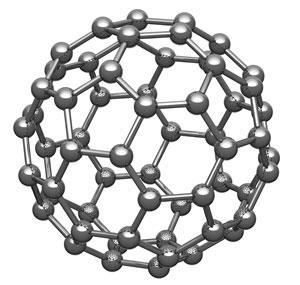
In C60 the bonds are not all equivalent: some connect the corners of two pentagonal rings (p), others connect hexagonal rings (h). According to the method of assigning bond order devised by Linus Pauling, these have bond orders of 0.28 and 0.44, respectively. (In Pauling’s scheme a single bond has order 0, and a double bond order 1. There are other schemes for assigning bond order, but the differences are minor.)
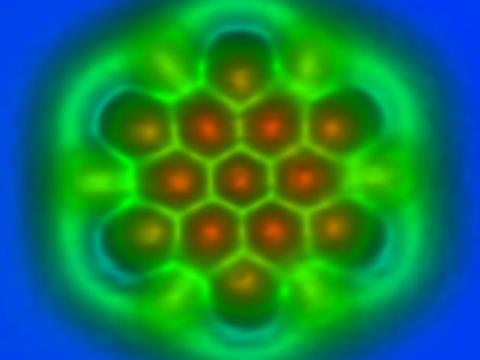
Using their CO-functionalised tip, Gross and colleagues imaged C60 adsorbed on copper. Only the topmost hexagonal ‘tile’ of the roughly spherical molecule appears in sharp contrast. The researchers use frequency modulation of the oscillating tip to measure the force between the tip and sample: changes in the resonant frequency of the tip are proportional to the force gradient as the tip approaches the surface. At close separation the force is repulsive, caused by Pauli repulsion as electrons in the tip and sample are prohibited from occupying the same region of space. So the greater the electron density in the sample, the brighter the image.
The researchers found that p and h bonds in the hexagonal C60 tile indeed had different tip resonant frequency shifts and thus different contrast. Moreover, their DFT calculations predicted frequency shifts closely matching those observed. They found the same correlation between brightness and bond order for planar PAHs, including dibenzo(cd,n)naphtho(3,2,1,8-pqra)perylene, which has five distinct types of C–C bond. Although small differences in bond order (less than about 0.2) can’t really be resolved using this approach, the trend of increasing brightness with increasing bond order remains clear.
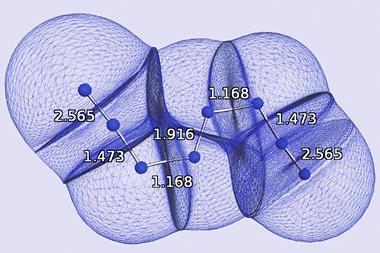
That’s not all. Bonds of different order also have different lengths – for the p and h bonds in C60, x-ray crystallography reveals a difference of about 5%. Such small differences would be extremely hard to spot in the AFM images. But by good fortune, the CO tilting at the tip turns out to amplify these distinctions and Gross and colleagues found that the length differences for C60 and the PAHs are visible by eye. The apparent lengths for the p and h bonds, for example, are 2.7Å and 2.0Å, respectively. Because of this amplification, the researchers say that (actual) bond length differences of just 0.03Å or so should be detectable.
‘It’s an exciting piece of work and a neat interpretation of state-of-the-art AFM data,’ says AFM specialist Philip Moriarty of the University of Nottingham, UK. But he has some reservations. ‘I find the planar molecule work more compelling than the C60 data,’ he says. ‘The curvature of the fullerene potentially presents a problem for interpreting the AFM image solely in terms of bond order.’ What’s more, Moriarty finds it disappointing that, as Gross and colleagues admit, attractive van der Waals interactions at the edges of molecules complicate the analysis in those regions.
Gross thinks that the approach might ultimately yield information about local atomic structures that could not be easily obtained by other methods, such as diffraction. ‘I would like to measure and study bonds around atomic defects in graphene,’ he says.


No comments yet