Open-source software allows thousands of trace chemicals to be analysed using 3D scans and mass spec
The vast array of trace molecules on and around us can now be mapped in 3D by any lab with a mass spectrometer thanks to researchers who have released open-source software and step-by-step instructions and for their visualisation technique.
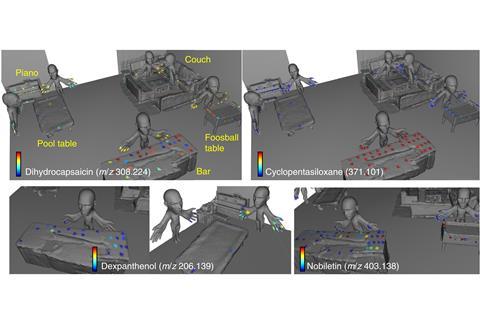
A team led by Pieter Dorrestein of the University of California, San Diego, US, and Theodore Alexandrov now at the European Molecular Biology Laboratory in Heidelburg, Germany, demonstrated their 3D molecular cartography technique in the past by mapping the chemical trails left by human contact in a variety of everyday environments.
But their methods were time consuming, often taking months of computer work. To make things simpler and faster the team has now developed a more streamlined protocol with new, more user-friendly software that people can operate without specialist computing knowledge.
The technique works by first taking a 3D scan or 2D photograph of the area to be mapped. Object surfaces are then sampled with cotton swabs to collect small molecules, metabolites, lipids and peptides that can be identified using liquid-chromatography mass spectrometry. The team developed user-friendly software that can produce interactive maps of chemicals by combining the mass spec data with coordinates from the 3D or 2D model.
‘With 3D cartography we get a direct look at the data while placing it in context of the 2D or 3D image of the object sampled,’ says Dorrestein. ‘The utility ranges from people studying dissolved organic matter in the oceans … to epidemiology, forensics and medicine, from global scale to sub-millimetre.’
‘New and improved techniques for visualising the 3D distribution of chemicals for medical, ecological or forensic investigations are welcomed,’ comments Stewart Walker, a forensic and analytical chemist at Flinders University in Australia. But he suspects the whole process may still be too costly for most labs. ‘To take more than 72 hours for 100 points including 16 hours of sample preparation, 30 hours of mass spectrometry time and 20 hours of library searching is going to restrict the number of instances where the returns justify the expense in time, facilities, staff and instrument costs,’ he says.
But Janet Jansson of Pacific Northwest National Laboratory, US, anticipates that the protocol will be ‘very popular and a game changer,’ in her field of microbial ecology. ‘We look forward to applying this protocol to understand molecular communication signals between microbes in association with the human body and with plants,’ she says. ‘I am particularly entranced with the combination of metabolomics and 3D molecular cartography that will allow us to visualise the specific locations where metabolites are found.’
References
I Protsyuk et al, Nat. Protoc. DOI: 10.1038/nprot.2017.122


No comments yet