
Researchers have developed a simple web app that converts thin layer chromatography (TLC) into a quantitative analytical technique.
TLC separates compound mixtures on a sheet covered with an adsorbent material through the action of a solvent. One of the most basic analyses, chemists use TLC to monitor a reaction’s progress or quickly estimate a sample’s purity. There are also preparative versions that work like miniature chromatography columns. Students are often introduced to TLC by separating the components in black ink or identifying chemicals in leaf extracts.
But TLC has been limited to qualitative analyses – it can tell a chemist how many different compounds a mixture contains but not how much of each component there is. Stefan Guldin from University College London, UK, and his team have now changed that with qTLC, an app that uses smartphone photos to calculate compound concentrations.
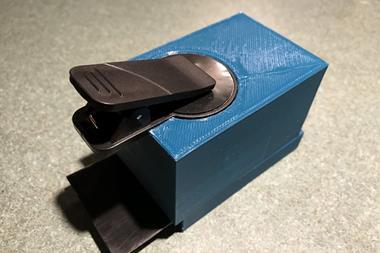
Users simply need to place at least three samples of known concentration next to one of unknown concentration on their TLC plate and run it. They then need to visualise the spots – usually by placing the dried plate under ultraviolet light – and photographing it.
The program first creates a calibration curve from the spots containing known sample concentrations. From this, it estimates the concentration in an unknown sample.
Although the app automatically corrects for uneven illumination, a clear photo, along with accurate calibration, are important. To reduce user error and bias during quantification, the program automatically determines a spot’s size and intensity.
The researchers hope their program will allow students to not only observe the separation process but also learn about TLC’s quantifying powers.
References
N M Fhionnlaoich et al, J. Chem. Educ., 2018, 95, 2191 (DOI: 10.1021/acs.jchemed.8b00144)


No comments yet